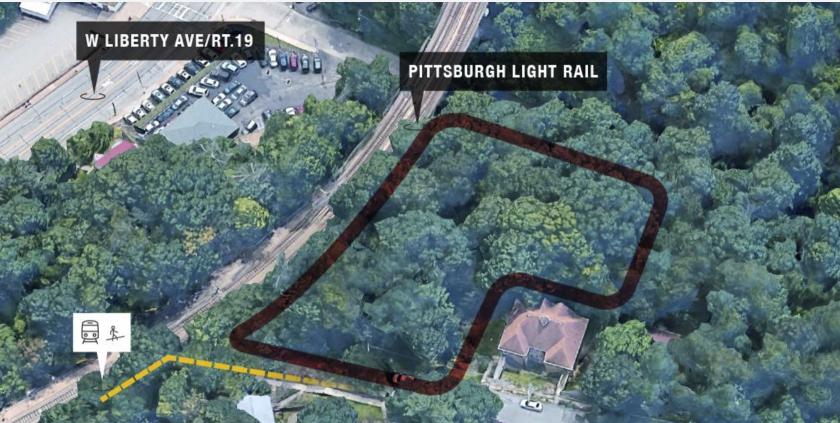
1-Mile | 3-Miles | 5-Miles | ||
---|---|---|---|---|
Total Population | 15,284 | 152,133 | 364,221 | |
Population Median Age | 40 | 39 | 39 | |
Population by Age | 0-9 Yrs | 1583 (10%) | 14070 (9%) | 33626 (9%) |
10-19 Yrs | 1232 (8%) | 16208 (10%) | 42628 (11%) | |
20-29 Yrs | 2691 (17%) | 30429 (20%) | 71385 (19%) | |
30-39 Yrs | 2743 (17%) | 25007 (16%) | 54415 (14%) | |
40-49 Yrs | 1646 (10%) | 15572 (10%) | 35905 (9%) | |
50-59 Yrs | 2107 (13%) | 19284 (12%) | 44942 (12%) | |
60-69 Yrs | 1548 (10%) | 16257 (10%) | 41211 (11%) | |
70+ Yrs | 1735 (11%) | 15305 (10%) | 40109 (11%) | |
Median HH Income | $54,642 | $56,878 | $54,712 | |
Total Household Income | < 24K | 1421 (19%) | 15565 (22%) | 40458 (25%) |
25-49K | 1893 (26%) | 14981 (22%) | 34676 (21%) | |
50-74K | 1401 (19%) | 11708 (17%) | 26210 (16%) | |
75-99K | 1051 (14%) | 8625 (12%) | 20206 (12%) | |
100-199K | 1265 (17%) | 13568 (19%) | 30955 (19%) | |
200K+ | 147 (2%) | 3616 (5%) | 8799 (5%) | |
Highest Education Level | No Diploma | 1005 | 7645 | 17513 |
Diploma or GED | 3544 | 30036 | 69346 | |
Some College | 1884 | 17705 | 40581 | |
Assoc. Degree | 1190 | 9524 | 22787 | |
Bachelors Degree | 2635 | 26411 | 59856 | |
Higher Degree | 1047 | 17053 | 43179 | |
Total Housing Units | 8,237 | 77,353 | 181,608 | |
--Owner-Occupied | 4,525 | 36,795 | 89,323 | |
--Renter-Occupied | 2,653 | 31,268 | 71,982 | |
Owner-Occupied Values | < 100K | 2434 | 13927 | 29075 |
100-199K | 1811 | 14051 | 35930 | |
200-299K | 152 | 5221 | 13229 | |
300-399K | 70 | 1764 | 4933 | |
400-499K | 51 | 841 | 2413 | |
500K+ | 7 | 991 | 3743 | |
Total Working Age Population | 12,885 | 129,817 | 310,574 | |
In Work Force | 9,048 | 85,266 | 197,099 | |
Not In Work Force | 3,837 | 44,551 | 113,474 | |
Workforce Employed | 8,642 | 81,251 | 187,098 | |
Workforce Unemployed | 389 | 3,933 | 9,804 | |
Civlian Workforce | 9,031 | 85,184 | 196,902 | |
Military Workforce | 17 | 83 | 198 | |
Total Households | 7,178 | 68,062 | 161,304 | |
Family Households | 3,271 | 32,342 | 78,162 | |
Non-Family Households | 3,907 | 35,720 | 83,143 | |
Married Couple | 2,114 | 21,827 | 53,694 | |
Other Family | 1,156 | 10,515 | 24,467 | |
Married w/Child | 802 | 7,617 | 18,658 | |
Single Male w/Child | 157 | 1,187 | 2,659 | |
Single Female w/Child | 314 | 4,072 | 9,485 |
Population Change Last Two Decades - Plus Projection
2000 | % | 2010 | % | 2020 | % | 2030 | |
---|---|---|---|---|---|---|---|
Pennsylvania | 12,281,054 | +3 | 12,702,379 | +4 | 13,230,170 | +4 | 13,759,594 |
Allegheny County | 1,281,666 | -5 | 1,223,348 | +3 | 1,265,919 | +3 | 1,307,654 |
Washington County | 202,897 | +2 | 207,820 | 0 | 206,942 | 0 | 207,065 |
Total Working Age Population:
Total Households:
Total Working Age Population:
Total Households:
Total Working Age Population:
Total Households: