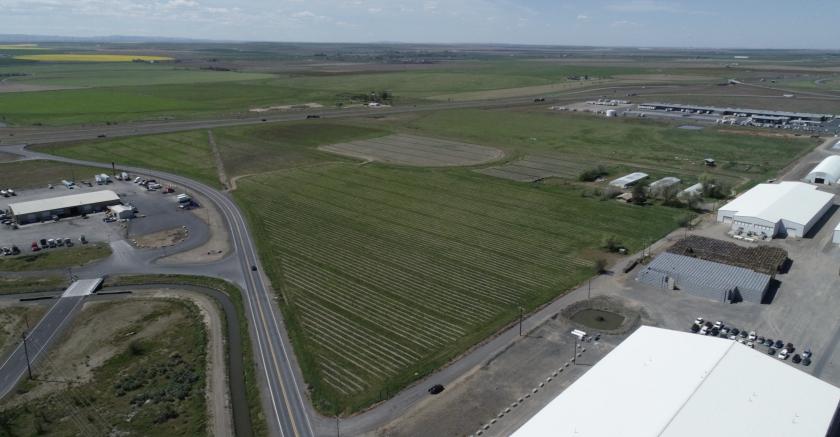
1-Mile | 3-Miles | 5-Miles | ||
---|---|---|---|---|
Total Population | 130 | 1,065 | 10,067 | |
Population Median Age | 37 | 39 | 37 | |
Population by Age | 0-9 Yrs | 24 (18%) | 164 (15%) | 1775 (17%) |
10-19 Yrs | 20 (15%) | 145 (13%) | 1151 (11%) | |
20-29 Yrs | 12 (9%) | 126 (11%) | 1441 (14%) | |
30-39 Yrs | 14 (10%) | 110 (10%) | 1480 (14%) | |
40-49 Yrs | 16 (12%) | 137 (12%) | 889 (8%) | |
50-59 Yrs | 18 (13%) | 136 (12%) | 912 (9%) | |
60-69 Yrs | 11 (8%) | 106 (9%) | 1286 (12%) | |
70+ Yrs | 16 (12%) | 141 (13%) | 1132 (11%) | |
Median HH Income | $78,690 | $75,105 | $51,522 | |
Total Household Income | < 24K | 11 (23%) | 94 (24%) | 814 (21%) |
25-49K | 6 (13%) | 56 (14%) | 993 (26%) | |
50-74K | 5 (10%) | 45 (11%) | 709 (19%) | |
75-99K | 4 (8%) | 41 (10%) | 478 (12%) | |
100-199K | 12 (26%) | 106 (27%) | 596 (16%) | |
200K+ | 7 (15%) | 49 (12%) | 116 (3%) | |
Highest Education Level | No Diploma | 4 | 56 | 1578 |
Diploma or GED | 20 | 157 | 1633 | |
Some College | 25 | 224 | 1647 | |
Assoc. Degree | 9 | 82 | 690 | |
Bachelors Degree | 16 | 125 | 670 | |
Higher Degree | 10 | 81 | 450 | |
Total Housing Units | 52 | 433 | 4,090 | |
--Owner-Occupied | 38 | 318 | 2,471 | |
--Renter-Occupied | 8 | 72 | 1,236 | |
Owner-Occupied Values | < 100K | 2 | 20 | 535 |
100-199K | 6 | 55 | 884 | |
200-299K | 17 | 144 | 712 | |
300-399K | 3 | 21 | 123 | |
400-499K | 6 | 56 | 179 | |
500K+ | 3 | 20 | 38 | |
Total Working Age Population | 96 | 815 | 7,604 | |
In Work Force | 59 | 501 | 4,683 | |
Not In Work Force | 36 | 314 | 2,921 | |
Workforce Employed | 56 | 461 | 4,365 | |
Workforce Unemployed | 2 | 37 | 304 | |
Civlian Workforce | 59 | 497 | 4,669 | |
Military Workforce | 0 | 4 | 14 | |
Total Households | 46 | 390 | 3,707 | |
Family Households | 31 | 261 | 2,511 | |
Non-Family Households | 14 | 129 | 1,196 | |
Married Couple | 22 | 188 | 1,853 | |
Other Family | 9 | 72 | 658 | |
Married w/Child | 8 | 72 | 765 | |
Single Male w/Child | 0 | 0 | 69 | |
Single Female w/Child | 4 | 30 | 386 |
Population Change Last Two Decades - Plus Projection
2000 | % | 2010 | % | 2020 | % | 2030 | |
---|---|---|---|---|---|---|---|
Oregon | 3,421,399 | +12 | 3,831,074 | +11 | 4,264,810 | +11 | 4,727,438 |
Morrow County | 10,995 | +2 | 11,173 | +10 | 12,329 | +5 | 12,960 |
Umatilla County | 70,548 | +8 | 75,889 | +4 | 78,692 | +5 | 82,943 |
Washington | 5,894,121 | +14 | 6,724,540 | +14 | 7,638,415 | +11 | 8,503,178 |
Benton County | 142,475 | +23 | 175,177 | +15 | 201,563 | +13 | 228,162 |
Total Working Age Population:
Total Households:
Total Working Age Population:
Total Households:
Total Working Age Population:
Total Households: