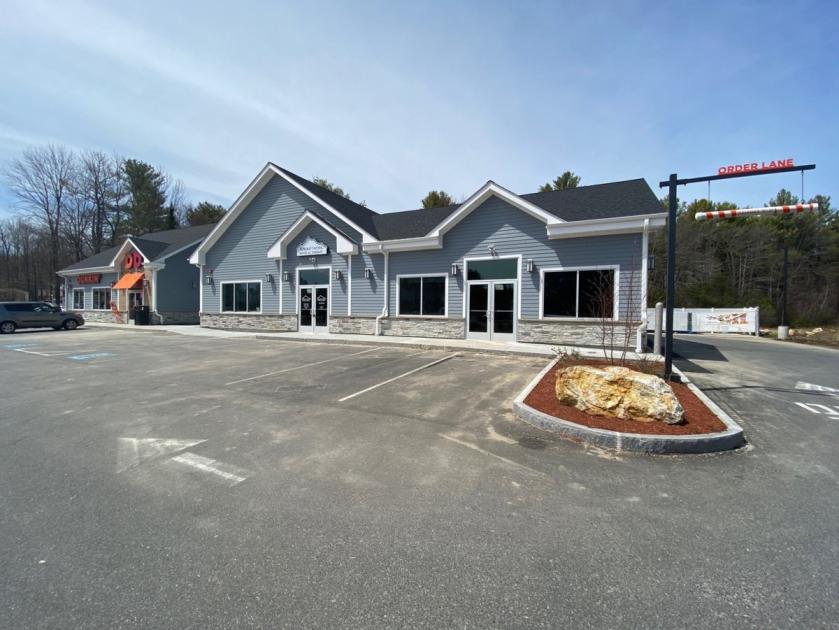
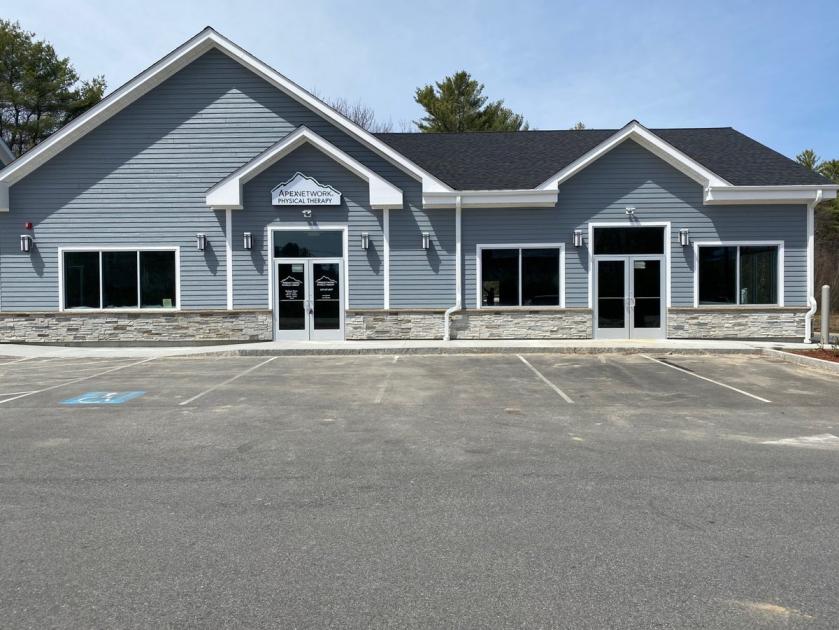
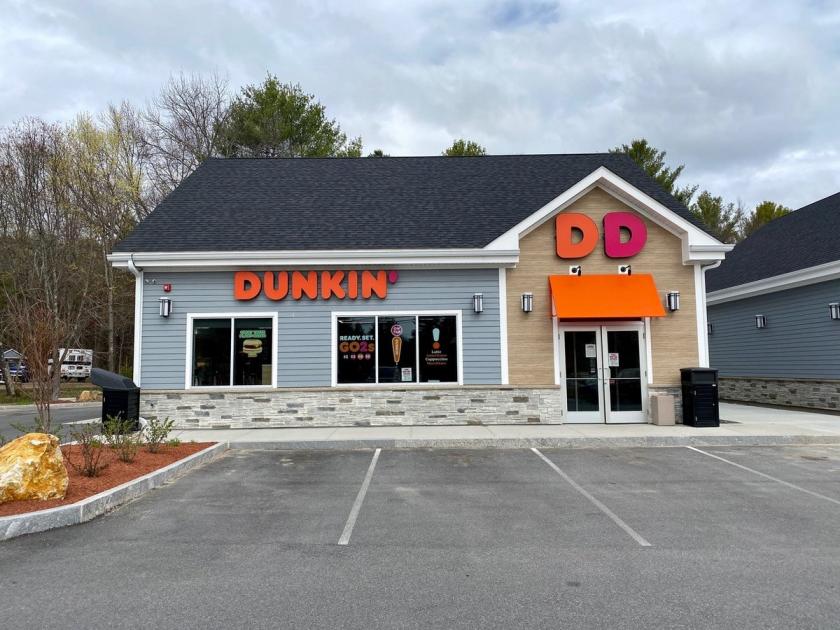
Join Dunkin’ and Apex Physical Therapy at this beautiful newly constructed plaza at Lebanon Crossing.
Highly sought after endcap space with drive thru availability - bring us your plans and your fit ups can be ready in as little as 45 days. Zoning can accommodate various business types with endless opportunities ranging from retail, medical as well as financial institutions.
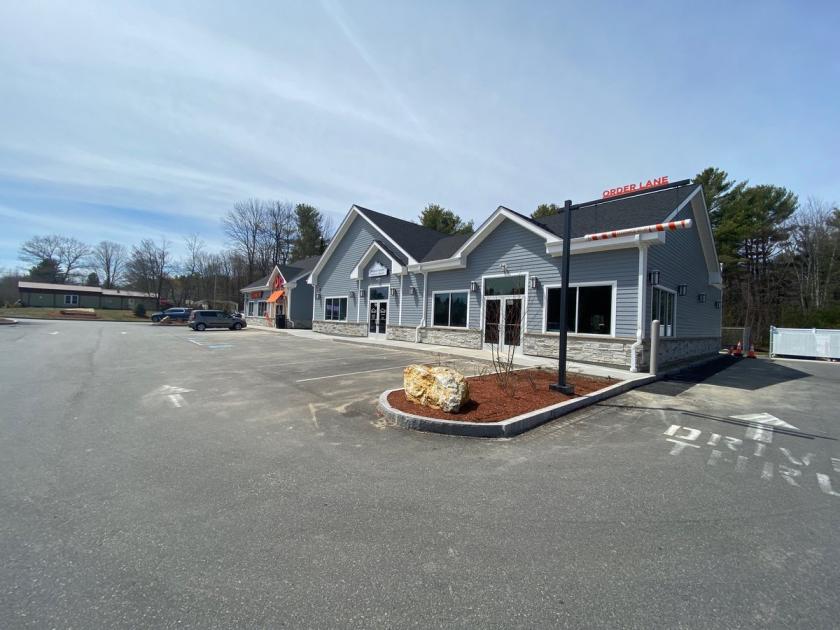
This well situated plaza with high visibility is located near a signalized intersection and offers direct signage and access to State Route 202 (Carl Broggi Highway) as well as manicured grounds, and ample parking. High-growth region is the gateway route between Maine and NH and makes an excellent location for your business.
**1,500± SF End Cap with Drive – Thru or Pick Up Window
**Premium Office with ample space to help spread your teams
**Super fast cable internet
**Located at Signalized Intersection
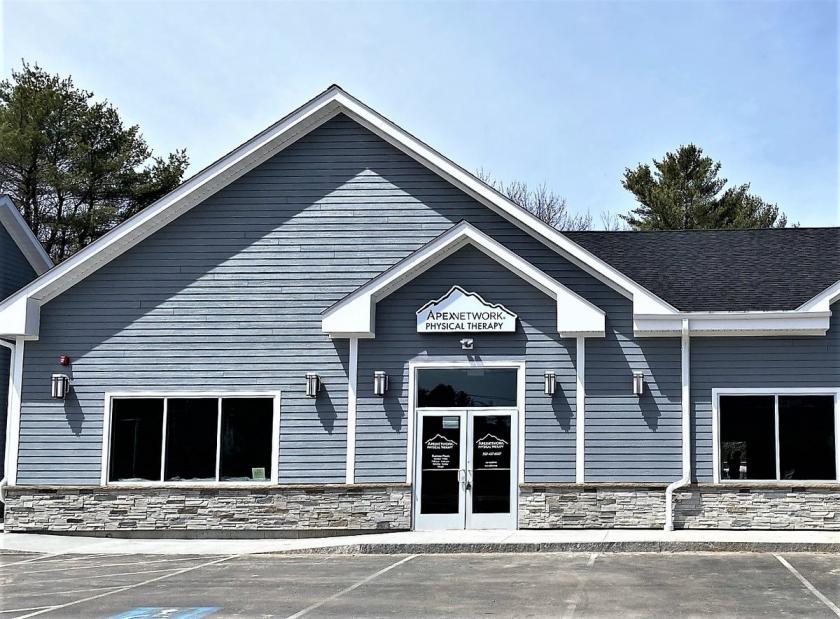
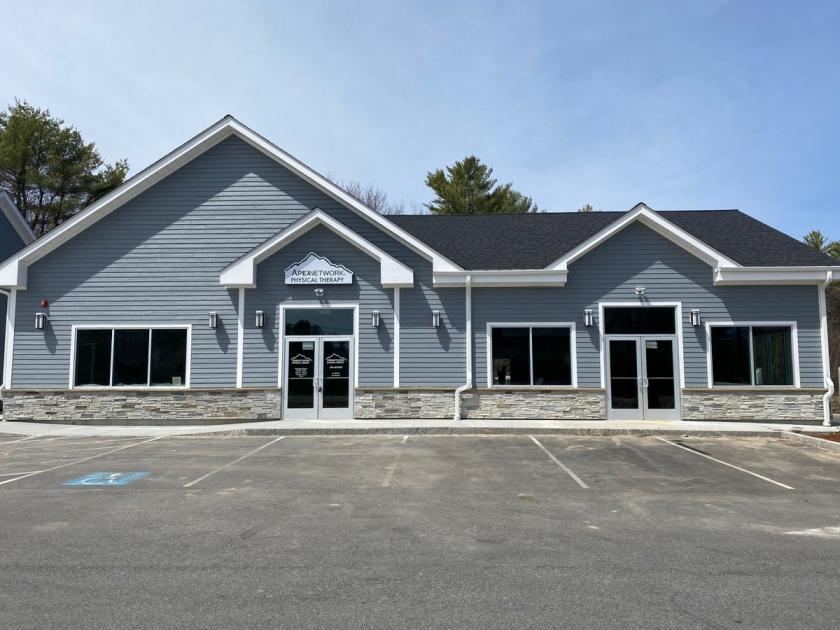
**Excellent Signage/Visibility
**Manicured Grounds
**Ample Parking
No part of this information may be copied, reproduced, repurposed, or screen-captured for any commercial purpose without prior written authorization from MyEListing.
While we strive to provide the most accurate information, all listing information, and demographic data, is provided by third-parties. As such, MyEListing will not be responsible for the accuracy of the information. It is strongly recommended that you verify all information with the listing agent, and any relevant agencies, prior to making any decisions.
What is the asking price for 291 Carl Broggi Highway in Lebanon?
The asking price for 291 Carl Broggi Highway is $20.00 a SF per Year
What is the building size of this commercial Retail property?
The size of this lease property at '.291 Carl Broggi Highway.' is 1500 square feet
What kind of Retail is the propery at 291 Carl Broggi Highway?
The property at 291 Carl Broggi Highway Lebanon, ME 04027 is listed as a Shopping Center Retail property
What is the population within 1 mile of 291 Carl Broggi Highway in Lebanon?
The population within 1 mile of 291 Carl Broggi Highway Lebanon, ME 04027 is 308 people.
Who do I contact for questions about 291 Carl Broggi Highway?
You should contact the listing agent,
Deana Arden, for any details regarding this commercial listing.