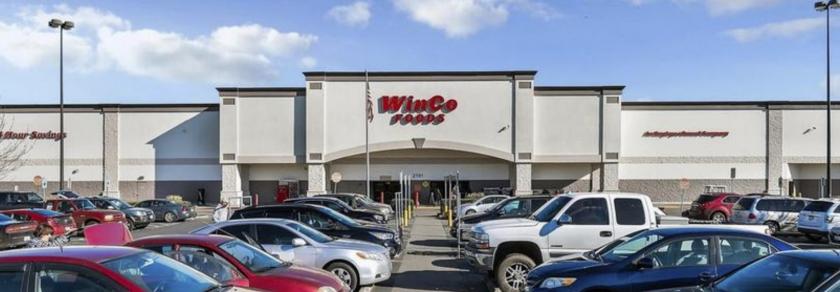
Retail Space
6904 NE 44th Cir Vancouver, WA 98661
6904 NE 44th Cir Vancouver, WA 98661
Details & Description
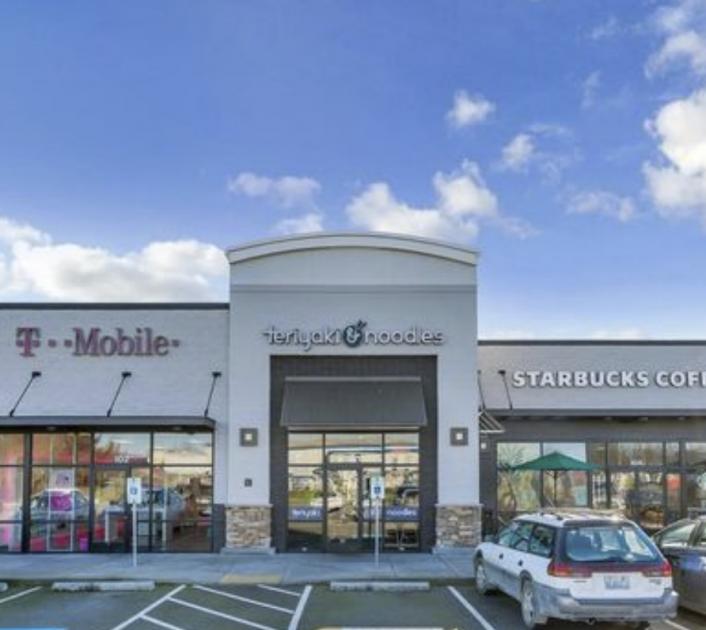
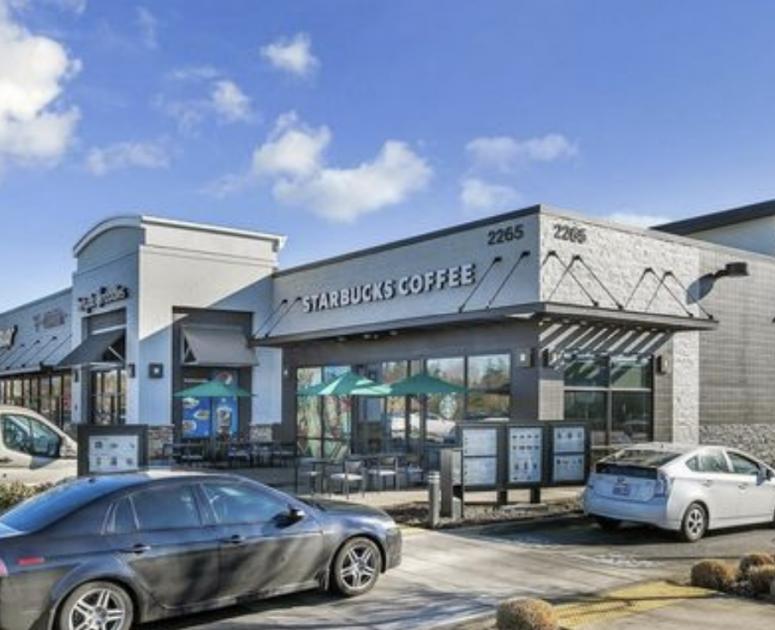
Additional Photos

Listing Agents

Matthew Sichel
O: 503-972-7206
M: 503-702-5955
msichel@naielliott.com
O: 503-972-7206
M: 503-702-5955
msichel@naielliott.com

George Macoubray
O: 503-972-5411
M: 503-504-2957
gmacoubray@naielliott.com
O: 503-972-5411
M: 503-504-2957
gmacoubray@naielliott.com
While we strive to provide the most accurate information, all listing information, and demographic data, is provided by third-parties. As such, MyEListing will not be responsible for the accuracy of the information. It is strongly recommended that you verify all information with the listing agent, and any relevant agencies, prior to making any decisions.


