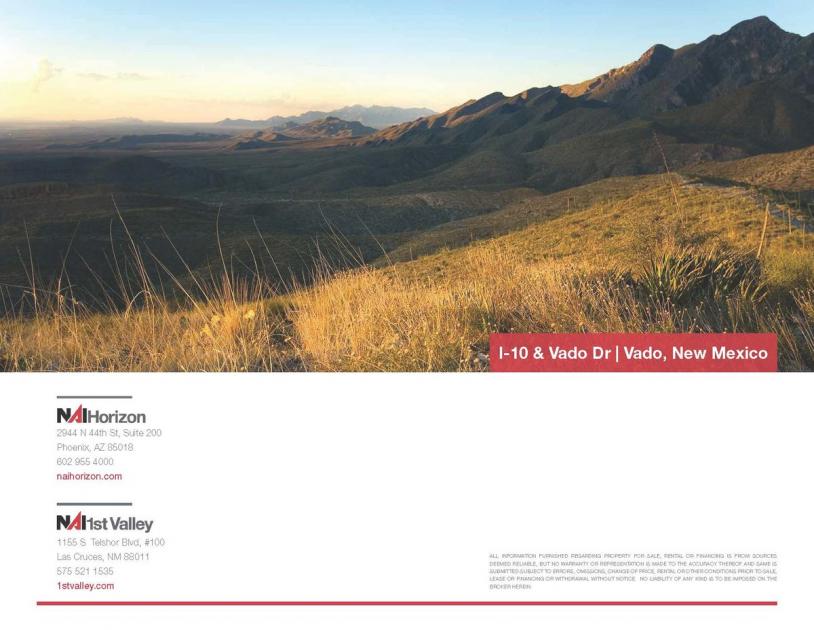
1-Mile | 3-Miles | 5-Miles | ||
---|---|---|---|---|
Total Population | 1,676 | 4,270 | 8,147 | |
Population Median Age | 30 | 34 | 36 | |
Population by Age | 0-9 Yrs | 283 (16%) | 703 (16%) | 1277 (15%) |
10-19 Yrs | 408 (24%) | 768 (17%) | 1442 (17%) | |
20-29 Yrs | 204 (12%) | 565 (13%) | 909 (11%) | |
30-39 Yrs | 184 (10%) | 428 (10%) | 985 (12%) | |
40-49 Yrs | 260 (15%) | 556 (13%) | 932 (11%) | |
50-59 Yrs | 208 (12%) | 495 (11%) | 898 (11%) | |
60-69 Yrs | 122 (7%) | 484 (11%) | 921 (11%) | |
70+ Yrs | 7 (0%) | 271 (6%) | 782 (9%) | |
Median HH Income | $32,927 | $33,044 | $33,473 | |
Total Household Income | < 24K | 159 (39%) | 465 (37%) | 946 (36%) |
25-49K | 170 (42%) | 524 (41%) | 971 (37%) | |
50-74K | 11 (2%) | 86 (6%) | 197 (7%) | |
75-99K | 57 (14%) | 92 (7%) | 194 (7%) | |
100-199K | 2 (0%) | 83 (6%) | 237 (9%) | |
200K+ | 0 (0%) | 2 (0%) | 15 (0%) | |
Highest Education Level | No Diploma | 484 | 1237 | 2264 |
Diploma or GED | 169 | 595 | 1113 | |
Some College | 161 | 407 | 834 | |
Assoc. Degree | 2 | 68 | 203 | |
Bachelors Degree | 29 | 137 | 293 | |
Higher Degree | 10 | 47 | 181 | |
Total Housing Units | 434 | 1,412 | 2,959 | |
--Owner-Occupied | 264 | 924 | 1,981 | |
--Renter-Occupied | 135 | 328 | 579 | |
Owner-Occupied Values | < 100K | 55 | 429 | 990 |
100-199K | 182 | 359 | 596 | |
200-299K | 26 | 87 | 238 | |
300-399K | 0 | 17 | 79 | |
400-499K | 1 | 31 | 73 | |
500K+ | 0 | 0 | 6 | |
Total Working Age Population | 1,109 | 3,051 | 5,953 | |
In Work Force | 529 | 1,495 | 3,092 | |
Not In Work Force | 580 | 1,555 | 2,860 | |
Workforce Employed | 446 | 1,318 | 2,817 | |
Workforce Unemployed | 83 | 177 | 273 | |
Civlian Workforce | 529 | 1,495 | 3,090 | |
Military Workforce | 0 | 0 | 3 | |
Total Households | 399 | 1,251 | 2,561 | |
Family Households | 357 | 1,029 | 2,128 | |
Non-Family Households | 42 | 222 | 433 | |
Married Couple | 215 | 759 | 1,498 | |
Other Family | 142 | 270 | 630 | |
Married w/Child | 92 | 295 | 587 | |
Single Male w/Child | 0 | 23 | 99 | |
Single Female w/Child | 96 | 161 | 329 |
Population Change Last Two Decades - Plus Projection
2000 | % | 2010 | % | 2020 | % | 2030 | |
---|---|---|---|---|---|---|---|
New Mexico | 1,819,046 | +13 | 2,059,179 | +6 | 2,187,183 | +6 | 2,308,475 |
Doña Ana County | 174,682 | +20 | 209,233 | +11 | 232,946 | +9 | 255,070 |
Total Working Age Population:
Total Households:
Total Working Age Population:
Total Households:
Total Working Age Population:
Total Households: