Reasonably priced mixed use development opportunity in the fastest growing area in Las Cruces
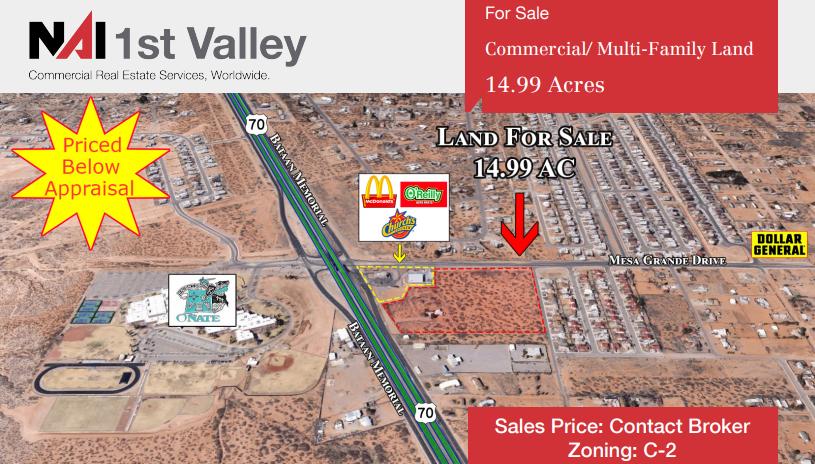
• Approximately 14.99 Acres
• City utilities (water, sewer, and gas) in Mesa Grande
• Excellent visibility from highway 70
• Adjacent to McDonald's, O'Reilly Auto Parts and Church's Chicken
• In close proximity to Onate High School, Family Dollar and Dollar General
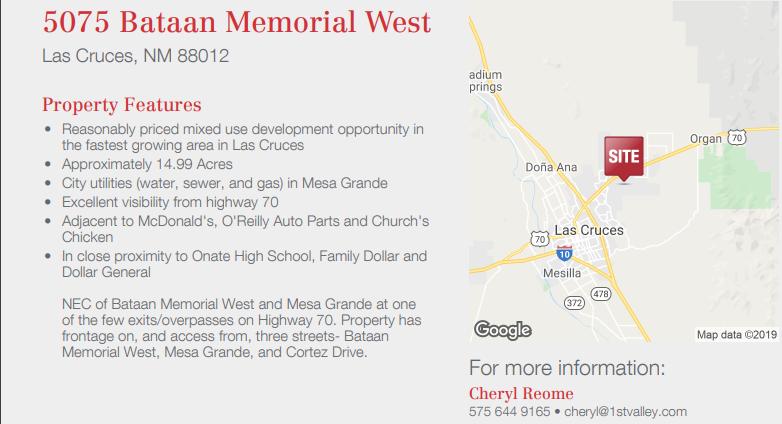
NEC of Bataan Memorial West and Mesa Grande at one of the few exits/overpasses on Highway 70. Property has frontage on, and access from, three streets- Bataan Memorial West, Mesa Grande, and Cortez Drive.
No part of this information may be copied, reproduced, repurposed, or screen-captured for any commercial purpose without prior written authorization from MyEListing.
While we strive to provide the most accurate information, all listing information, and demographic data, is provided by third-parties. As such, MyEListing will not be responsible for the accuracy of the information. It is strongly recommended that you verify all information with the listing agent, and any relevant agencies, prior to making any decisions.
How much land does the Las Cruces, NM property at 5075 Bataan Memorial include?
5075 Bataan Memorial in Las Cruces includes 14.990 acres of land
What kind of Land is the propery at 5075 Bataan Memorial?
The property at 5075 Bataan Memorial Las Cruces, NM 88012 is listed as a Mixed Use Land Land property
What is the population within 1 mile of 5075 Bataan Memorial in Las Cruces?
The population within 1 mile of 5075 Bataan Memorial Las Cruces, NM 88012 is 3,717 people.
Who do I contact for questions about 5075 Bataan Memorial?
You should contact the listing agent,
Cheryl Reome, for any details regarding this commercial listing.