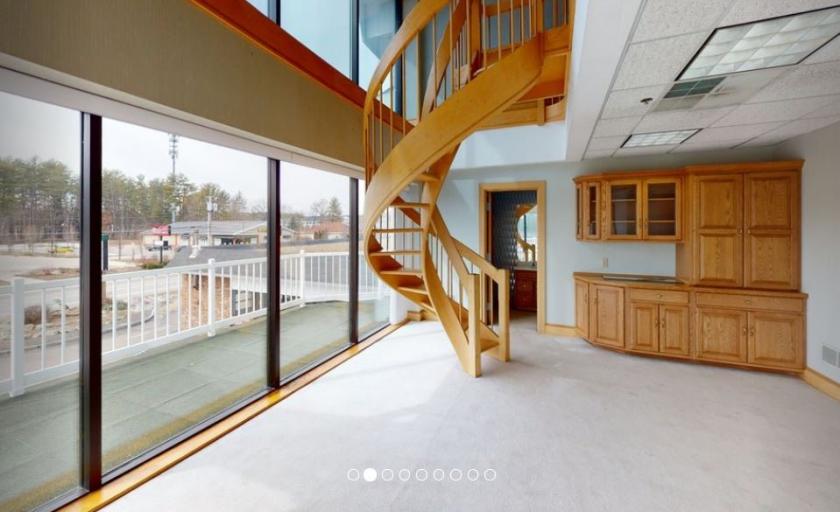
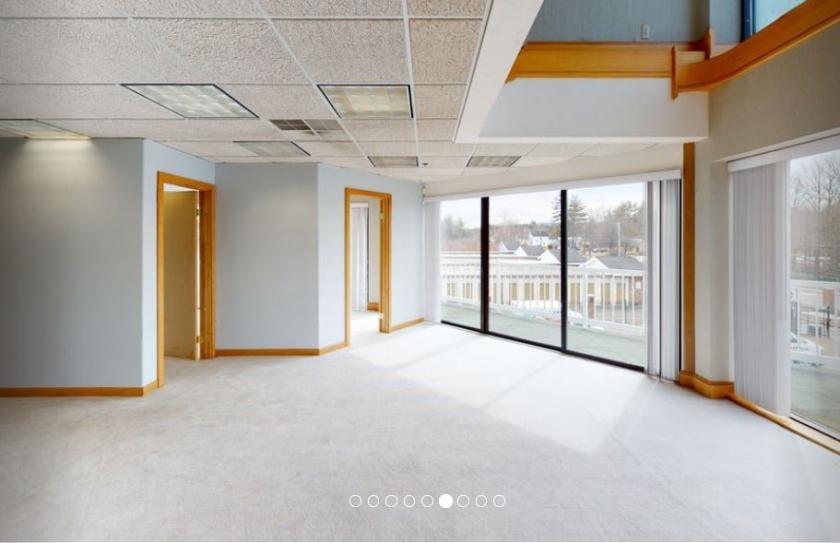
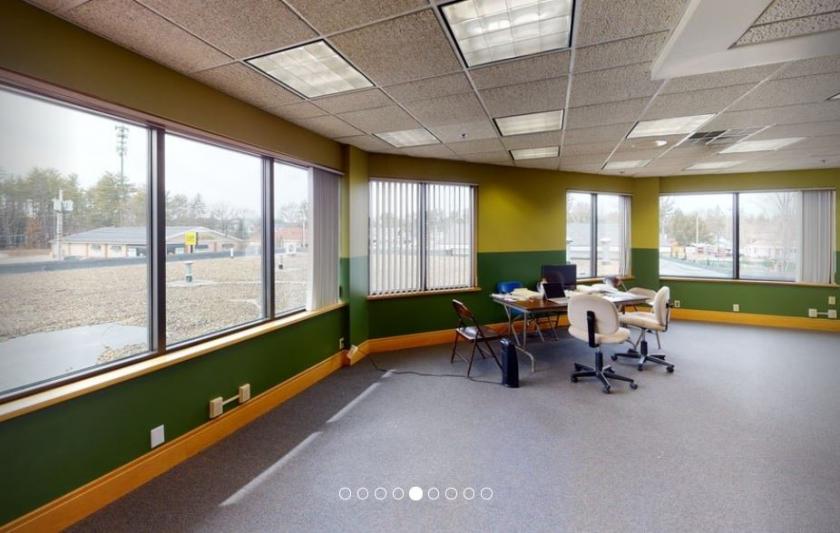
Office Space
204 Fisherville Road Concord, NH 03303
204 Fisherville Road Concord, NH 03303
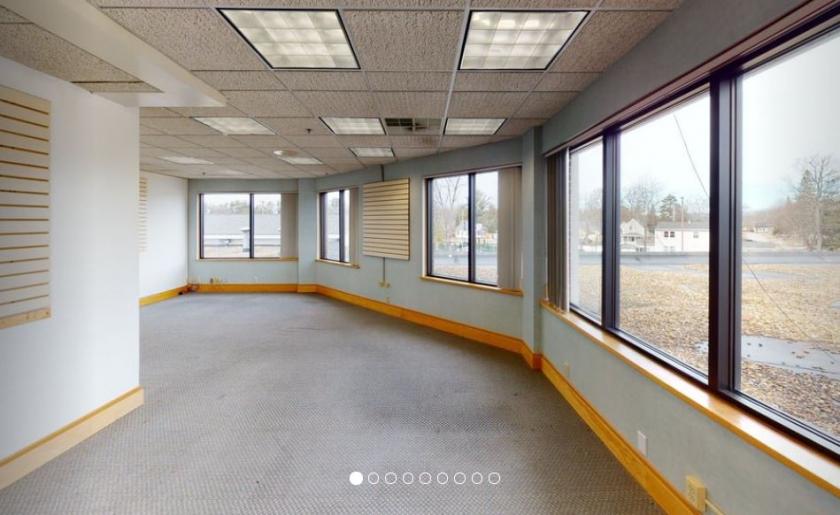
Details & Description
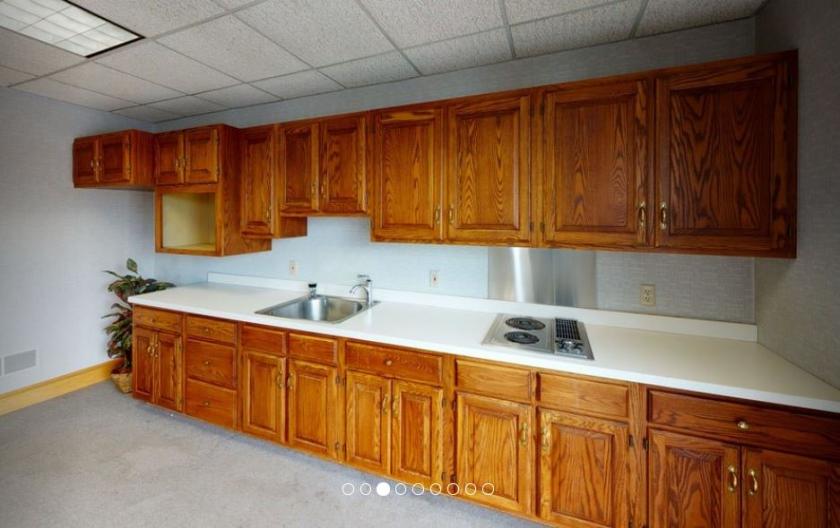
Additional Photos

Listing Agents

Joe Robinson
O: 603-668-7000
M: 603-714-4019
jrobinson@nainorwoodgroup.com
O: 603-668-7000
M: 603-714-4019
jrobinson@nainorwoodgroup.com

Joseph Mendola
O: 603668700020
M: 603-496-4512
jmendola@nainorwoodgroup.com
O: 603668700020
M: 603-496-4512
jmendola@nainorwoodgroup.com
While we strive to provide the most accurate information, all listing information, and demographic data, is provided by third-parties. As such, MyEListing will not be responsible for the accuracy of the information. It is strongly recommended that you verify all information with the listing agent, and any relevant agencies, prior to making any decisions.