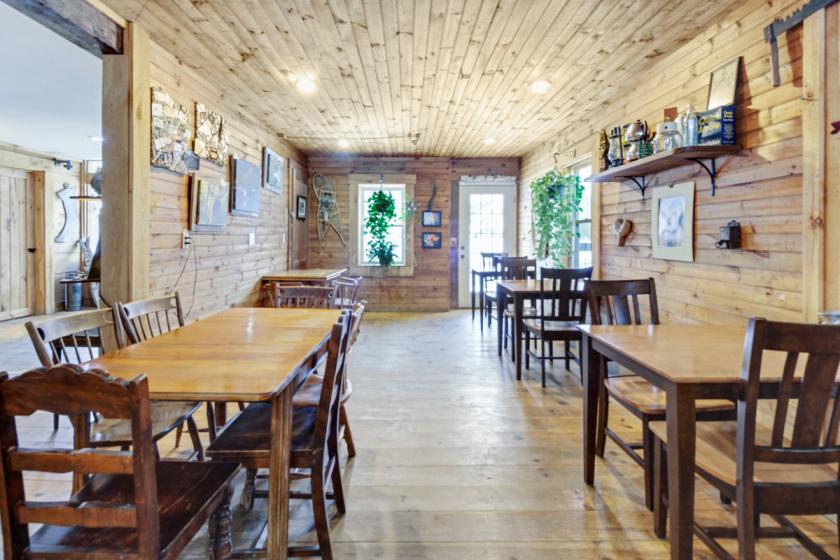
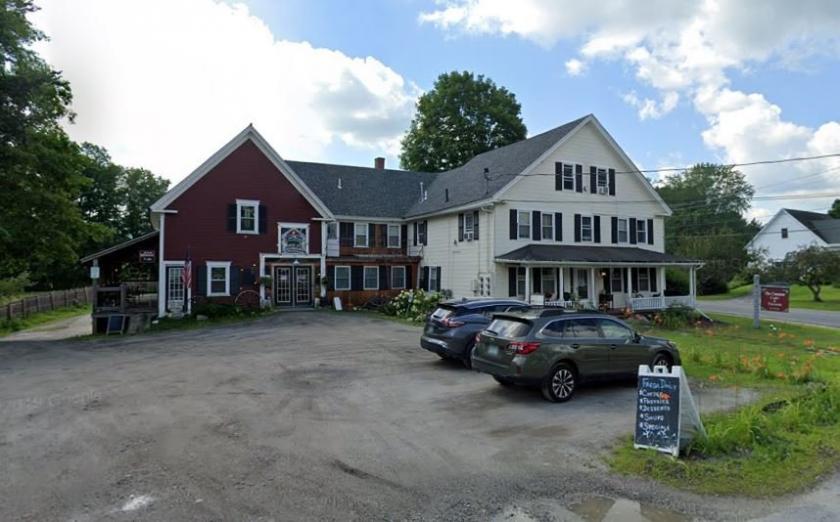
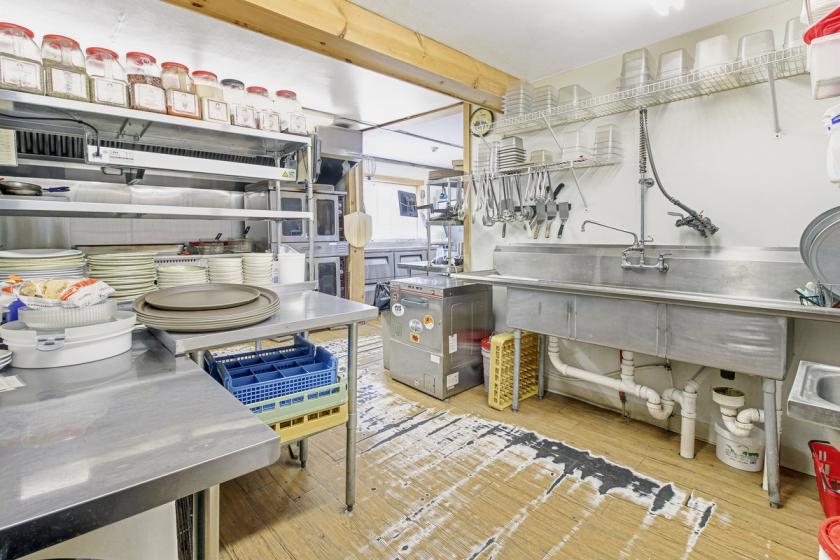
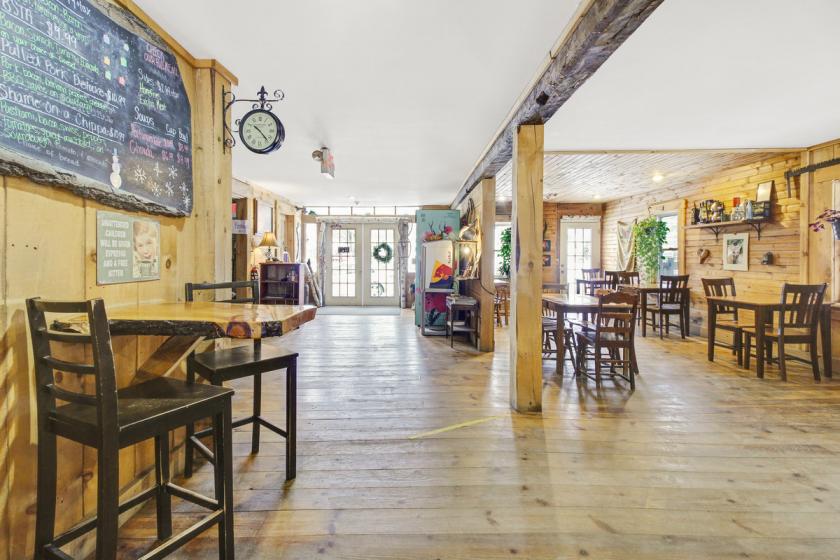
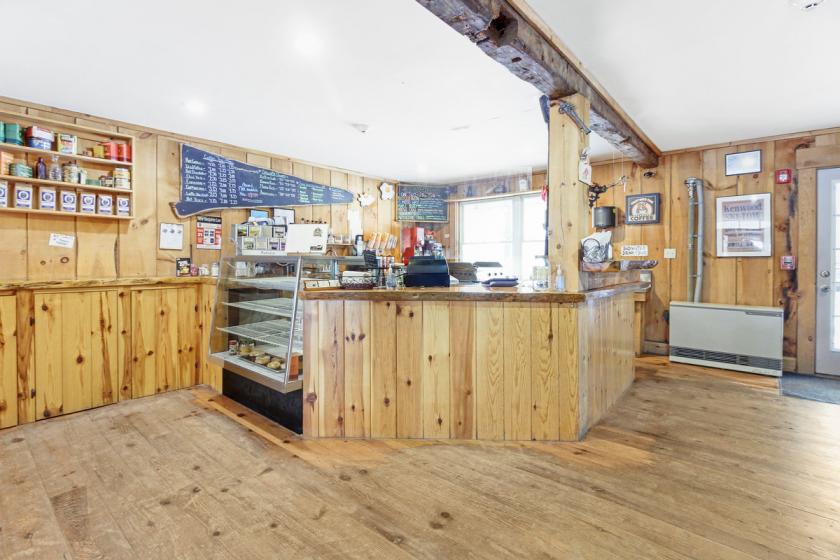
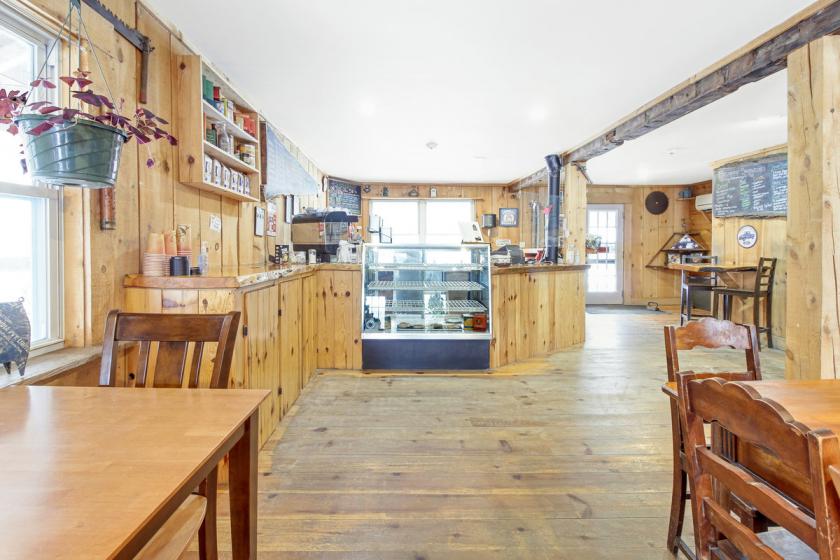
1-Mile | 3-Miles | 5-Miles | ||
---|---|---|---|---|
Total Population | 119 | 868 | 3,076 | |
Population Median Age | 43 | 44 | 45 | |
Population by Age | 0-9 Yrs | 11 (9%) | 74 (8%) | 277 (9%) |
10-19 Yrs | 16 (13%) | 110 (12%) | 352 (11%) | |
20-29 Yrs | 13 (10%) | 88 (10%) | 263 (8%) | |
30-39 Yrs | 12 (10%) | 87 (10%) | 323 (10%) | |
40-49 Yrs | 14 (11%) | 104 (11%) | 347 (11%) | |
50-59 Yrs | 22 (18%) | 157 (18%) | 488 (15%) | |
60-69 Yrs | 19 (15%) | 148 (17%) | 582 (18%) | |
70+ Yrs | 13 (10%) | 102 (11%) | 444 (14%) | |
Median HH Income | $53,682 | $53,609 | $46,300 | |
Total Household Income | < 24K | 10 (21%) | 75 (21%) | 395 (30%) |
25-49K | 11 (23%) | 82 (23%) | 284 (22%) | |
50-74K | 10 (21%) | 73 (21%) | 237 (18%) | |
75-99K | 8 (17%) | 54 (15%) | 141 (10%) | |
100-199K | 7 (15%) | 51 (14%) | 186 (14%) | |
200K+ | 1 (2%) | 9 (2%) | 38 (2%) | |
Highest Education Level | No Diploma | 7 | 55 | 196 |
Diploma or GED | 28 | 213 | 857 | |
Some College | 18 | 130 | 406 | |
Assoc. Degree | 9 | 63 | 210 | |
Bachelors Degree | 14 | 108 | 406 | |
Higher Degree | 8 | 62 | 240 | |
Total Housing Units | 72 | 559 | 1,892 | |
--Owner-Occupied | 38 | 282 | 879 | |
--Renter-Occupied | 8 | 61 | 402 | |
Owner-Occupied Values | < 100K | 7 | 47 | 144 |
100-199K | 14 | 107 | 366 | |
200-299K | 10 | 72 | 204 | |
300-399K | 5 | 40 | 117 | |
400-499K | 1 | 7 | 24 | |
500K+ | 1 | 8 | 25 | |
Total Working Age Population | 98 | 725 | 2,608 | |
In Work Force | 65 | 468 | 1,585 | |
Not In Work Force | 33 | 257 | 1,023 | |
Workforce Employed | 63 | 453 | 1,496 | |
Workforce Unemployed | 2 | 15 | 89 | |
Civlian Workforce | 65 | 468 | 1,585 | |
Military Workforce | 0 | 0 | 0 | |
Total Households | 46 | 343 | 1,282 | |
Family Households | 28 | 214 | 828 | |
Non-Family Households | 18 | 130 | 453 | |
Married Couple | 23 | 171 | 554 | |
Other Family | 6 | 42 | 275 | |
Married w/Child | 7 | 46 | 150 | |
Single Male w/Child | 2 | 16 | 88 | |
Single Female w/Child | 2 | 12 | 50 |
Population Change Last Two Decades - Plus Projection
2000 | % | 2010 | % | 2020 | % | 2030 | |
---|---|---|---|---|---|---|---|
New Hampshire | 1,235,786 | +7 | 1,316,470 | +3 | 1,349,908 | +4 | 1,402,878 |
Grafton County | 81,743 | +9 | 89,118 | +2 | 91,099 | +4 | 94,829 |
Total Working Age Population:
Total Households:
Total Working Age Population:
Total Households:
Total Working Age Population:
Total Households: