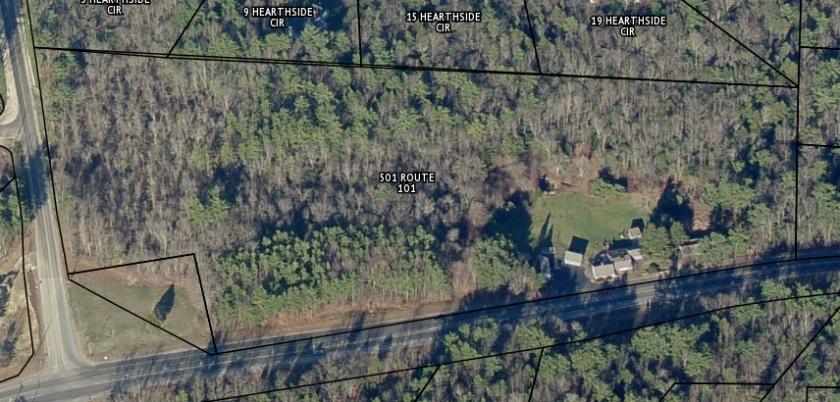
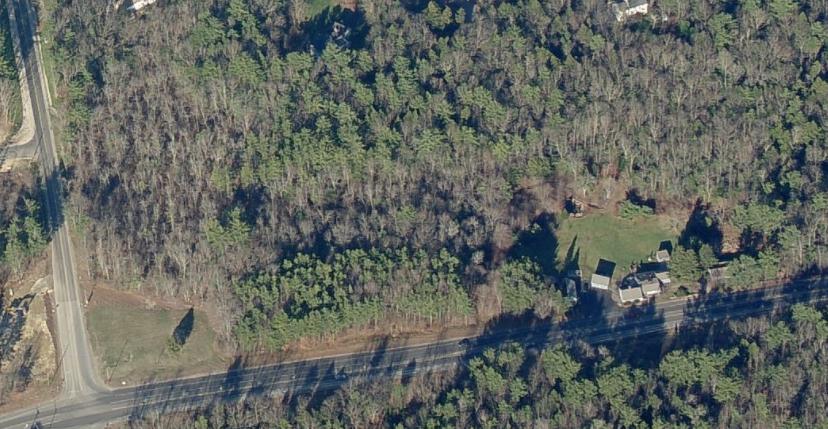
1-Mile | 3-Miles | 5-Miles | ||
---|---|---|---|---|
Total Population | 1,975 | 14,455 | 42,740 | |
Population Median Age | 38 | 38 | 40 | |
Population by Age | 0-9 Yrs | 280 (14%) | 2155 (14%) | 5184 (12%) |
10-19 Yrs | 345 (17%) | 2138 (14%) | 6294 (14%) | |
20-29 Yrs | 139 (7%) | 967 (6%) | 3499 (8%) | |
30-39 Yrs | 192 (9%) | 1775 (12%) | 4726 (11%) | |
40-49 Yrs | 357 (18%) | 2435 (16%) | 6359 (14%) | |
50-59 Yrs | 268 (13%) | 1950 (13%) | 7282 (17%) | |
60-69 Yrs | 259 (13%) | 1981 (13%) | 5555 (12%) | |
70+ Yrs | 136 (6%) | 1055 (7%) | 3839 (8%) | |
Median HH Income | $187,960 | $156,768 | $129,089 | |
Total Household Income | < 24K | 13 (2%) | 145 (3%) | 794 (5%) |
25-49K | 18 (3%) | 257 (5%) | 1385 (9%) | |
50-74K | 38 (6%) | 440 (9%) | 1551 (10%) | |
75-99K | 41 (6%) | 415 (8%) | 1593 (10%) | |
100-199K | 215 (35%) | 1901 (39%) | 6231 (41%) | |
200K+ | 275 (45%) | 1612 (33%) | 3620 (23%) | |
Highest Education Level | No Diploma | 0 | 60 | 647 |
Diploma or GED | 77 | 1203 | 4465 | |
Some College | 174 | 1256 | 4418 | |
Assoc. Degree | 118 | 828 | 2798 | |
Bachelors Degree | 541 | 3615 | 10121 | |
Higher Degree | 352 | 2648 | 6930 | |
Total Housing Units | 606 | 4,883 | 15,495 | |
--Owner-Occupied | 600 | 4,693 | 13,879 | |
--Renter-Occupied | 0 | 77 | 1,296 | |
Owner-Occupied Values | < 100K | 0 | 21 | 133 |
100-199K | 1 | 174 | 1129 | |
200-299K | 43 | 702 | 3284 | |
300-399K | 153 | 1466 | 4306 | |
400-499K | 204 | 1110 | 2420 | |
500K+ | 198 | 1219 | 2607 | |
Total Working Age Population | 1,475 | 10,844 | 33,399 | |
In Work Force | 1,024 | 7,861 | 24,223 | |
Not In Work Force | 451 | 2,982 | 9,175 | |
Workforce Employed | 996 | 7,636 | 23,413 | |
Workforce Unemployed | 28 | 225 | 796 | |
Civlian Workforce | 1,024 | 7,861 | 24,209 | |
Military Workforce | 0 | 0 | 14 | |
Total Households | 600 | 4,770 | 15,175 | |
Family Households | 563 | 4,128 | 12,318 | |
Non-Family Households | 37 | 642 | 2,857 | |
Married Couple | 503 | 3,510 | 10,359 | |
Other Family | 60 | 618 | 1,959 | |
Married w/Child | 226 | 1,534 | 4,011 | |
Single Male w/Child | 5 | 67 | 307 | |
Single Female w/Child | 28 | 274 | 752 |
Population Change Last Two Decades - Plus Projection
2000 | % | 2010 | % | 2020 | % | 2030 | |
---|---|---|---|---|---|---|---|
New Hampshire | 1,235,786 | +7 | 1,316,470 | +3 | 1,349,908 | +4 | 1,402,878 |
Hillsborough County | 380,841 | +5 | 400,721 | +2 | 409,478 | +4 | 424,492 |
Total Working Age Population:
Total Households:
Total Working Age Population:
Total Households:
Total Working Age Population:
Total Households: