Industrial Properties
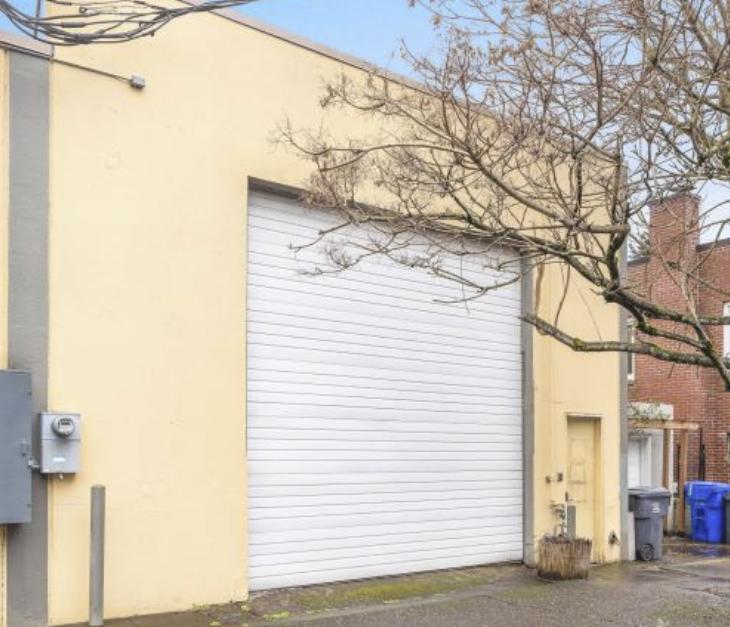
1119 Southeast Market Street Portland, OR 97214
1119 Southeast Market Street Portland, OR 97214
Details & Description
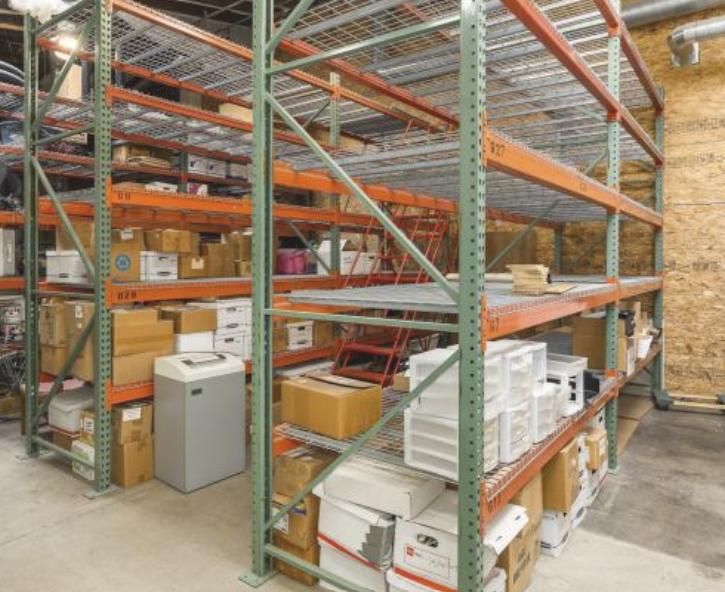
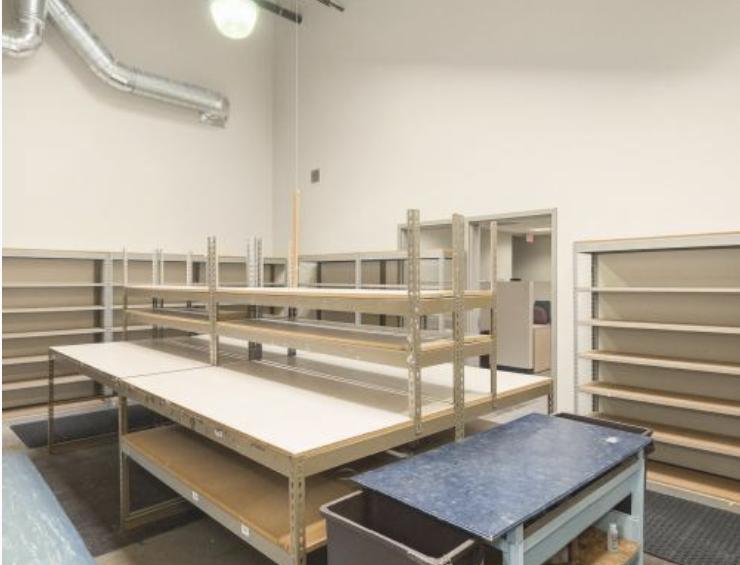
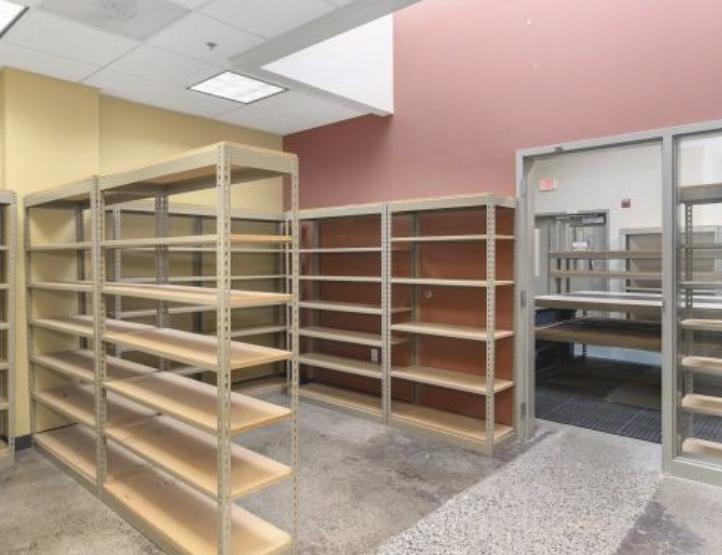
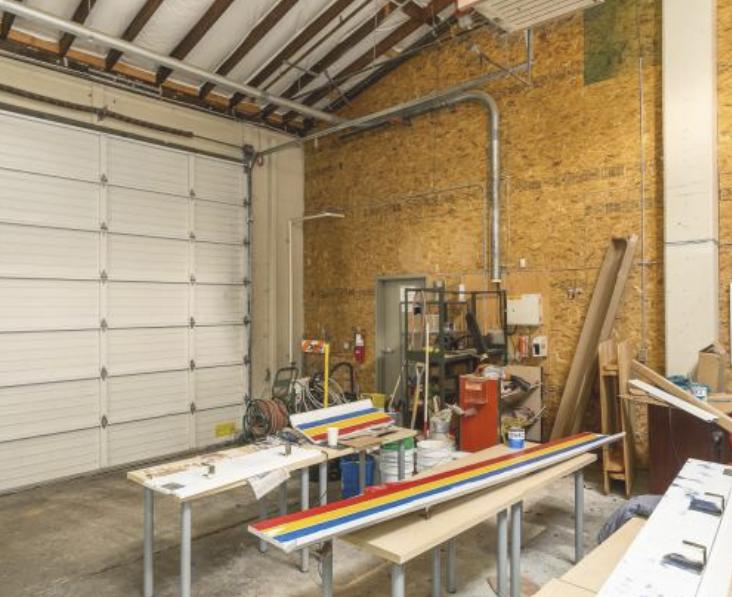
Additional Photos
Listing Agents

Rudy Puente
O: 503-972-7195
M: 503-803-4760
rpuente@naielliott.com
O: 503-972-7195
M: 503-803-4760
rpuente@naielliott.com
While we strive to provide the most accurate information, all listing information, and demographic data, is provided by third-parties. As such, MyEListing will not be responsible for the accuracy of the information. It is strongly recommended that you verify all information with the listing agent, and any relevant agencies, prior to making any decisions.


