Total SF: 289,301 +/-
Office SF: 11,796 +/-
Built: 1986
Improvements: 2006
Docks/Drive Ins: 7 docks | 2 drive ins
Production Area: 200,00 +/- Full HVAC
Parking: 286 spaces
Bay Dimensions: 40’ x 50’
Sprinkler: Yes
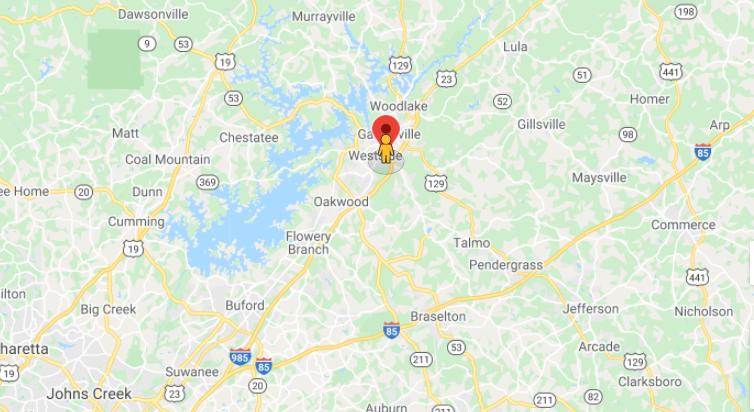
Close to Freeway, 37 miles from Atlanta Perimeter
Potential to add +/- 20 docks
Heavy Power | 27,000 amps, bus ducts and bus bars
Clear Height 28’
Brick/Masonry Construction
New roof
Excellent earning potential
130,000 RSF - 289,000 RSF Available
No part of this information may be copied, reproduced, repurposed, or screen-captured for any commercial purpose without prior written authorization from MyEListing.
While we strive to provide the most accurate information, all listing information, and demographic data, is provided by third-parties. As such, MyEListing will not be responsible for the accuracy of the information. It is strongly recommended that you verify all information with the listing agent, and any relevant agencies, prior to making any decisions.
What is the building size of this Industrial property in Gainesville, GA?
The size of the building/unit at 1215 Palmour Drive in Gainesville is 289,301 square feet
What kind of Industrial is the propery at 1215 Palmour Drive?
The property at 1215 Palmour Drive Gainesville, GA 30501 is listed as a Other Industrial Industrial property
What is the population within 1 mile of 1215 Palmour Drive in Gainesville?
The population within 1 mile of 1215 Palmour Drive Gainesville, GA 30501 is 3,051 people.
Who do I contact for questions about 1215 Palmour Drive?
You should contact the listing agent,
Ryan Blackburn, for any details regarding this commercial listing.