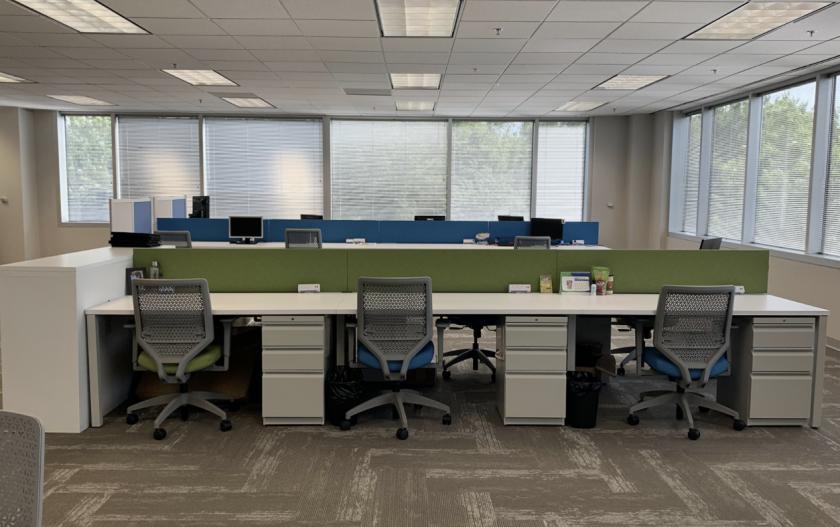
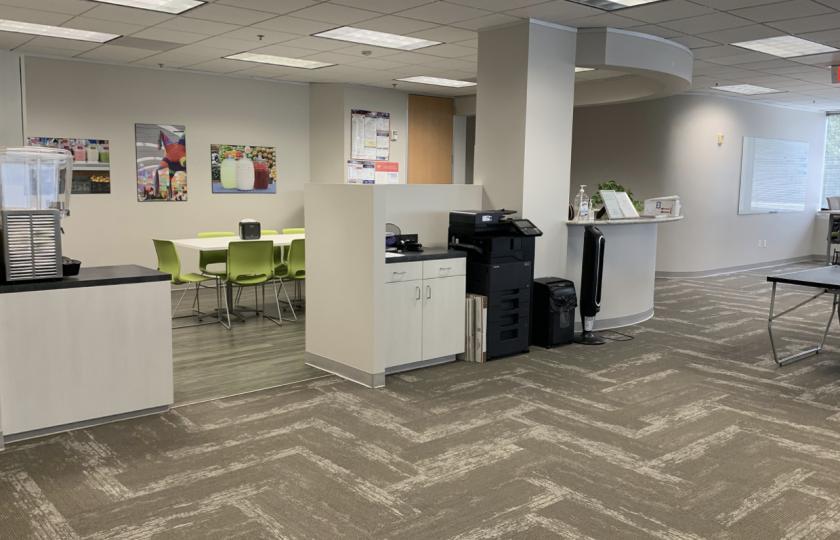
1-Mile | 3-Miles | 5-Miles | ||
---|---|---|---|---|
Total Population | 5,063 | 98,359 | 311,974 | |
Population Median Age | 48 | 40 | 37 | |
Population by Age | 0-9 Yrs | 372 (7%) | 10391 (10%) | 40000 (12%) |
10-19 Yrs | 407 (8%) | 11651 (11%) | 43433 (13%) | |
20-29 Yrs | 522 (10%) | 14150 (14%) | 45593 (14%) | |
30-39 Yrs | 487 (9%) | 12850 (13%) | 41460 (13%) | |
40-49 Yrs | 438 (8%) | 12609 (12%) | 41265 (13%) | |
50-59 Yrs | 776 (15%) | 13514 (13%) | 41294 (13%) | |
60-69 Yrs | 1141 (22%) | 13436 (13%) | 36769 (11%) | |
70+ Yrs | 921 (18%) | 9757 (9%) | 22161 (7%) | |
Median HH Income | $128,345 | $80,913 | $71,807 | |
Total Household Income | < 24K | 199 (10%) | 4423 (12%) | 14935 (14%) |
25-49K | 141 (7%) | 5857 (16%) | 20368 (20%) | |
50-74K | 180 (9%) | 6153 (17%) | 17602 (17%) | |
75-99K | 252 (13%) | 4767 (13%) | 12470 (12%) | |
100-199K | 605 (31%) | 9482 (26%) | 24513 (24%) | |
200K+ | 538 (28%) | 4440 (12%) | 11582 (11%) | |
Highest Education Level | No Diploma | 209 | 6408 | 29017 |
Diploma or GED | 444 | 12015 | 42120 | |
Some College | 717 | 12788 | 38129 | |
Assoc. Degree | 215 | 5092 | 13757 | |
Bachelors Degree | 1436 | 21431 | 51891 | |
Higher Degree | 969 | 12034 | 31803 | |
Total Housing Units | 2,018 | 37,208 | 107,371 | |
--Owner-Occupied | 1,740 | 22,204 | 63,610 | |
--Renter-Occupied | 174 | 12,919 | 37,859 | |
Owner-Occupied Values | < 100K | 27 | 1187 | 6447 |
100-199K | 153 | 6177 | 22298 | |
200-299K | 309 | 7220 | 15722 | |
300-399K | 484 | 4191 | 8672 | |
400-499K | 328 | 1531 | 4500 | |
500K+ | 439 | 1899 | 5971 | |
Total Working Age Population | 4,504 | 81,286 | 245,906 | |
In Work Force | 2,585 | 53,384 | 164,788 | |
Not In Work Force | 1,919 | 27,902 | 81,118 | |
Workforce Employed | 2,477 | 50,759 | 154,817 | |
Workforce Unemployed | 107 | 2,611 | 9,884 | |
Civlian Workforce | 2,585 | 53,370 | 164,701 | |
Military Workforce | 0 | 14 | 87 | |
Total Households | 1,915 | 35,122 | 101,469 | |
Family Households | 1,500 | 25,422 | 77,226 | |
Non-Family Households | 414 | 9,701 | 24,243 | |
Married Couple | 1,355 | 19,694 | 56,953 | |
Other Family | 146 | 5,728 | 20,273 | |
Married w/Child | 288 | 7,640 | 25,278 | |
Single Male w/Child | 2 | 377 | 1,837 | |
Single Female w/Child | 25 | 1,967 | 7,907 |
Population Change Last Two Decades - Plus Projection
2000 | % | 2010 | % | 2020 | % | 2030 | |
---|---|---|---|---|---|---|---|
Texas | 20,851,820 | +21 | 25,145,561 | +18 | 29,677,668 | +18 | 34,894,452 |
Brazoria County | 241,767 | +30 | 313,166 | +20 | 375,869 | +20 | 452,517 |
Fort Bend County | 354,452 | +65 | 585,375 | +44 | 840,383 | +43 | 1,203,029 |
Harris County | 3,400,578 | +20 | 4,092,459 | +22 | 4,978,845 | +19 | 5,924,750 |
Total Working Age Population:
Total Households:
Total Working Age Population:
Total Households:
Total Working Age Population:
Total Households: