Industrial Properties
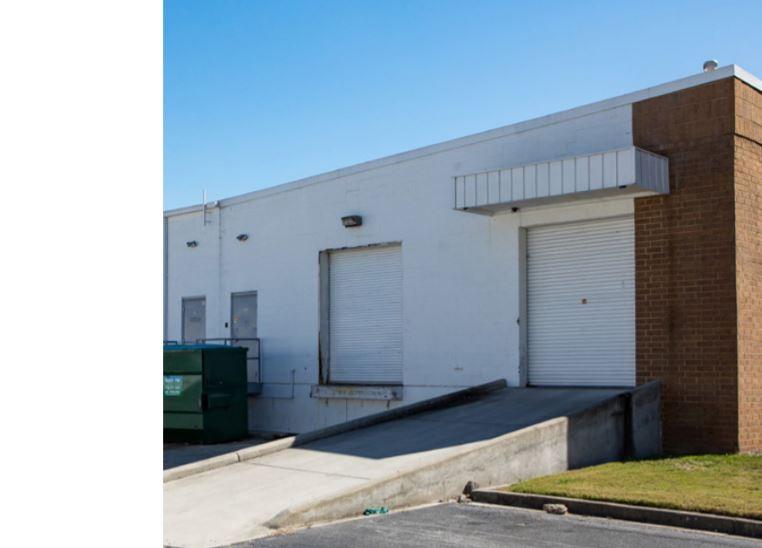
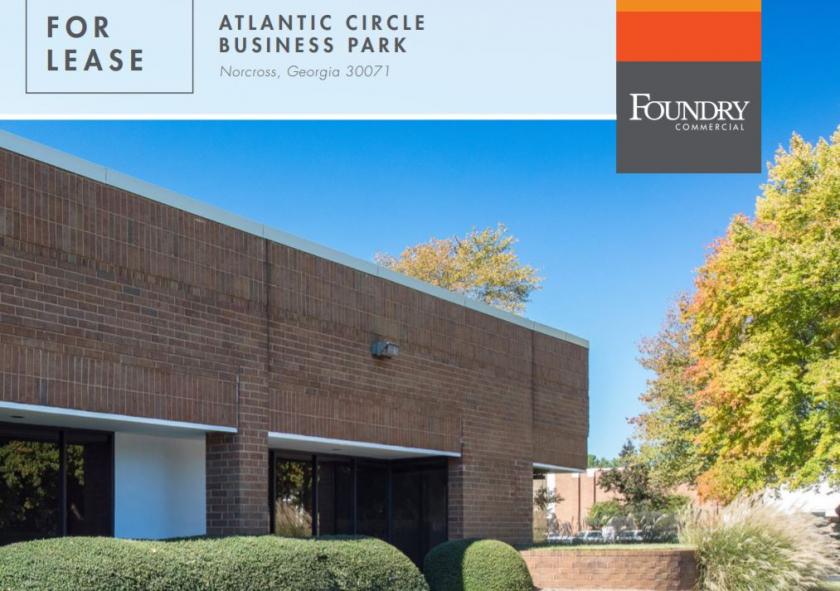
6400 Atlantic Boulevard Norcross, GA 30071
6400 Atlantic Boulevard Norcross, GA 30071
Details & Description
Listing Agents

Reid Hanner
O: 404-902-6767
REID.HANNER@FOUNDRYCOMMERCIAL.COM
O: 404-902-6767
REID.HANNER@FOUNDRYCOMMERCIAL.COM
While we strive to provide the most accurate information, all listing information, and demographic data, is provided by third-parties. As such, MyEListing will not be responsible for the accuracy of the information. It is strongly recommended that you verify all information with the listing agent, and any relevant agencies, prior to making any decisions.