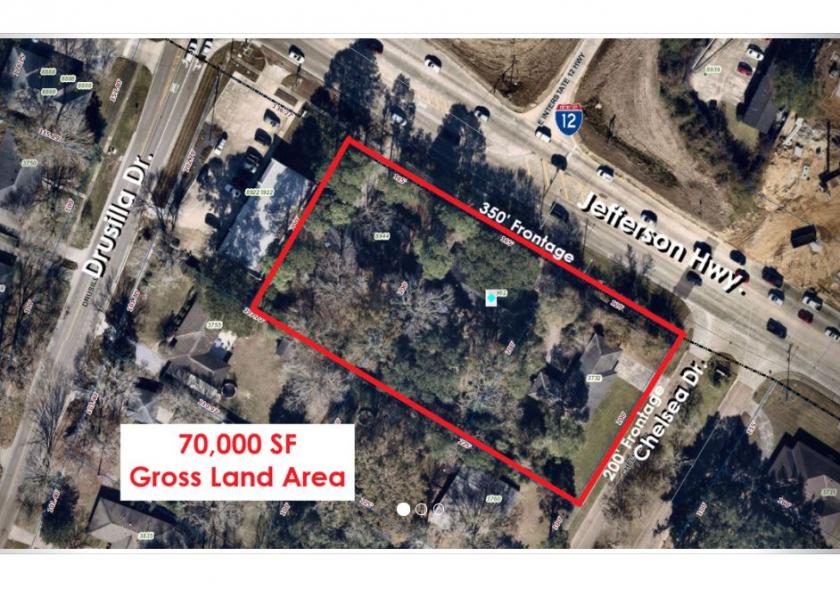
3 Lots totaling 70,000 SF (1.6 acres)
- Can be split in to two lots
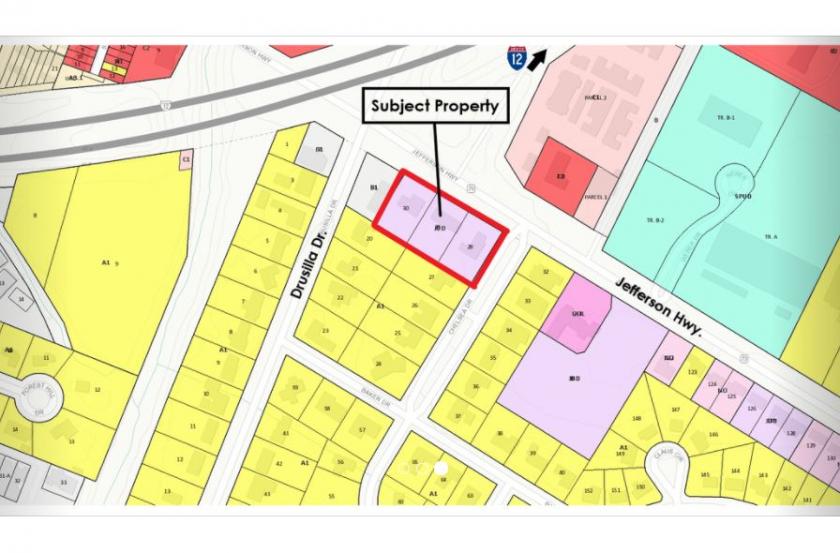
- Corner Lot at front of Westminster subdivision
- 350' of Frontage on Jefferson Hwy.
- 200' of Frontage on Chelsea Dr.
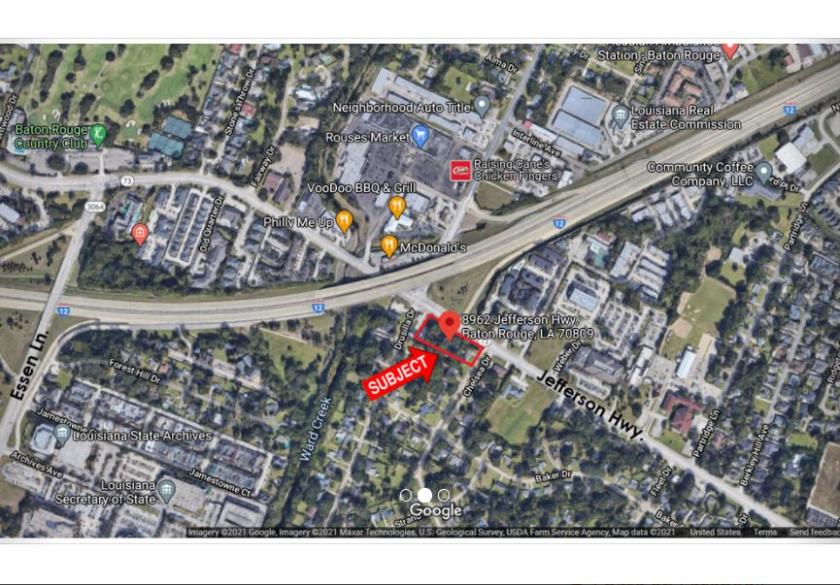
- Near busy Drusilla/Jefferson Intersection
- Excellent Visibility from I-12
- Zoned UDD4 in the Jefferson Highway Design District (JDD)
UDD4 Permitted Uses Include:
-Office Buildings with Max of 6,000 SF (Per Lot (3) for a total of 18,000 SF)
-Townhomes and/or Duplexes
-Single Family Residential
-Bank
-Medical Office or Clinic
No part of this information may be copied, reproduced, repurposed, or screen-captured for any commercial purpose without prior written authorization from MyEListing.
While we strive to provide the most accurate information, all listing information, and demographic data, is provided by third-parties. As such, MyEListing will not be responsible for the accuracy of the information. It is strongly recommended that you verify all information with the listing agent, and any relevant agencies, prior to making any decisions.
What is the asking price for 8962 Jefferson Highway in Baton Rouge?
The asking price for 8962 Jefferson Highway is $1,470,000
What is the building size of this Office property in Baton Rouge, LA?
The size of the building/unit at 8962 Jefferson Highway in Baton Rouge is 70,000 square feet
How much land does the Baton Rouge, LA property at 8962 Jefferson Highway include?
8962 Jefferson Highway in Baton Rouge includes 1.600 acres of land
What kind of Office is the propery at 8962 Jefferson Highway?
The property at 8962 Jefferson Highway Baton Rouge, LA 70809 is listed as a Medical Office property
What is the population within 1 mile of 8962 Jefferson Highway in Baton Rouge?
The population within 1 mile of 8962 Jefferson Highway Baton Rouge, LA 70809 is 7,214 people.
Who do I contact for questions about 8962 Jefferson Highway?
You should contact the listing agent,
Michael Stinson, for any details regarding this commercial listing.