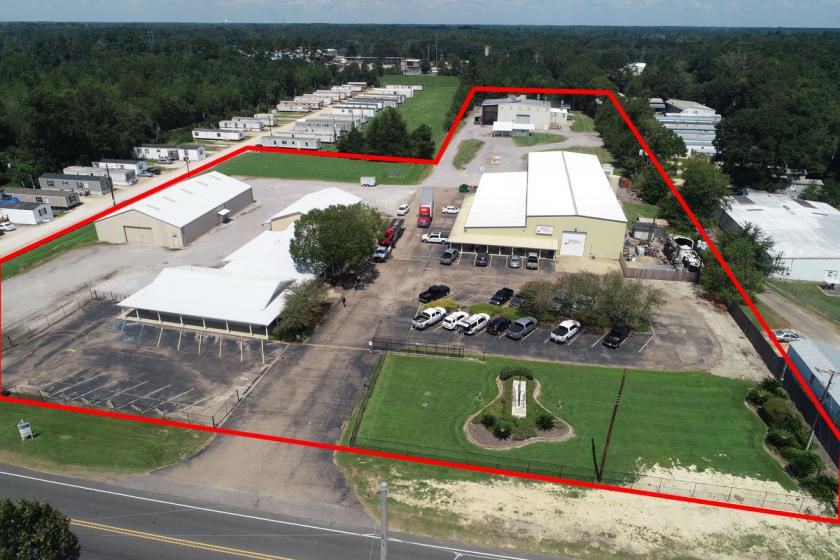
5 Year Leased Industrial Investment with *BONUS* Multiple Buildings totaling 25,563 SqFt on 7.5 + Acres.
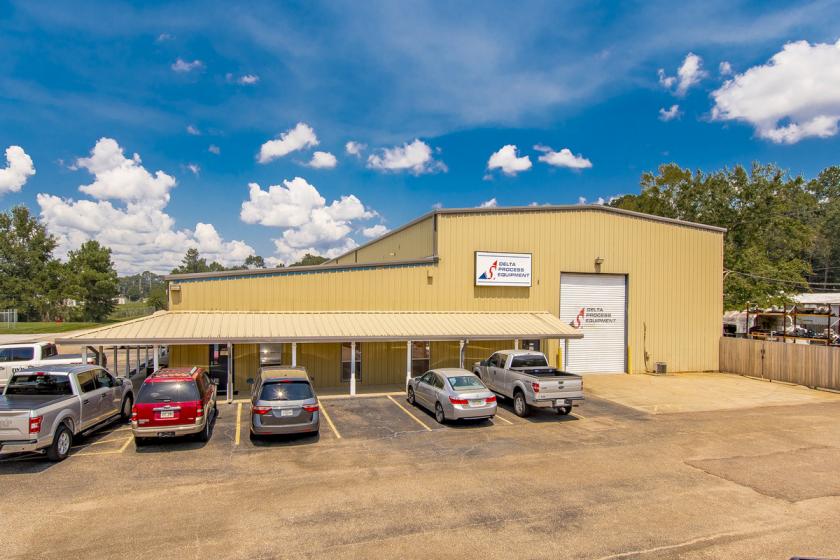
Building E: 17,793 SqFt Office/Warehouse Currently Leased to DXP Enterprises on a 5 Year NNN Lease with $67,369 NOI.
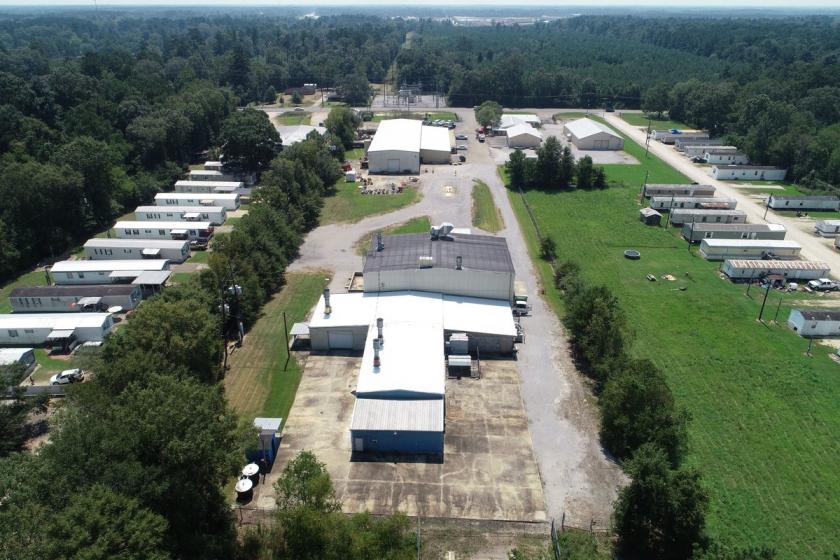
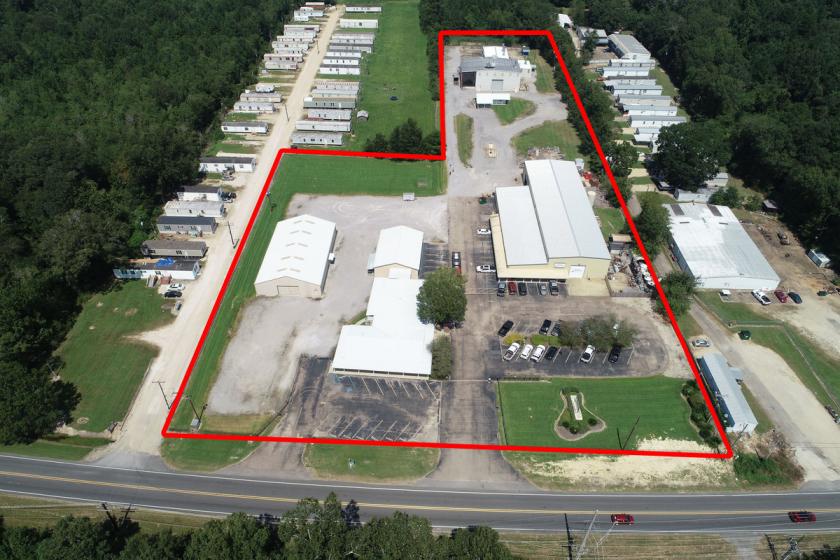
Property consists of five (5) buildings in total - see building breakdown below. Property is conducive for Lay-down Yard / Future Building Expansion. Did NOT Flood in 2016.
No Zoning, which allows for a multitude of uses. Building A is equipped with an EPA Title V Permit, which is a grandfathered clean air act permit allowing users increased air pollutant density.
Building A: 12,453 SqFt Warehouse
Building B: 4,710 SqFt Office
Building C: 5,880 SqFt Warehouse
Building D: 2,520 SqFt Warehouse
Total Land Size available is 7.7 Acres
Located in the "I-12 Corridor" on Florida Blvd in between S. Range and Juban Rd.
No part of this information may be copied, reproduced, repurposed, or screen-captured for any commercial purpose without prior written authorization from MyEListing.
While we strive to provide the most accurate information, all listing information, and demographic data, is provided by third-parties. As such, MyEListing will not be responsible for the accuracy of the information. It is strongly recommended that you verify all information with the listing agent, and any relevant agencies, prior to making any decisions.
What is the asking price for 8263 Florida Boulevard in Denham Springs?
The asking price for 8263 Florida Boulevard is $2,200,000
What is the building size of this Industrial property in Denham Springs, LA?
The size of the building/unit at 8263 Florida Boulevard in Denham Springs is 25,563 square feet
How much land does the Denham Springs, LA property at 8263 Florida Boulevard include?
8263 Florida Boulevard in Denham Springs includes 7.500 acres of land
What kind of Industrial is the propery at 8263 Florida Boulevard?
The property at 8263 Florida Boulevard Denham Springs, LA 70726 is listed as a Warehouse Industrial property
What is the population within 1 mile of 8263 Florida Boulevard in Denham Springs?
The population within 1 mile of 8263 Florida Boulevard Denham Springs, LA 70726 is 2,027 people.
Who do I contact for questions about 8263 Florida Boulevard?
You should contact the listing agent,
Matthew Shirley, for any details regarding this commercial listing.