Industrial Properties
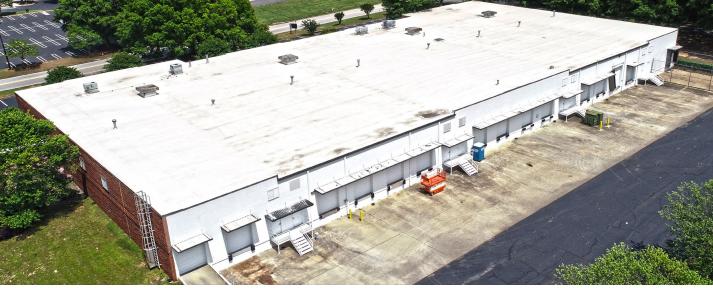
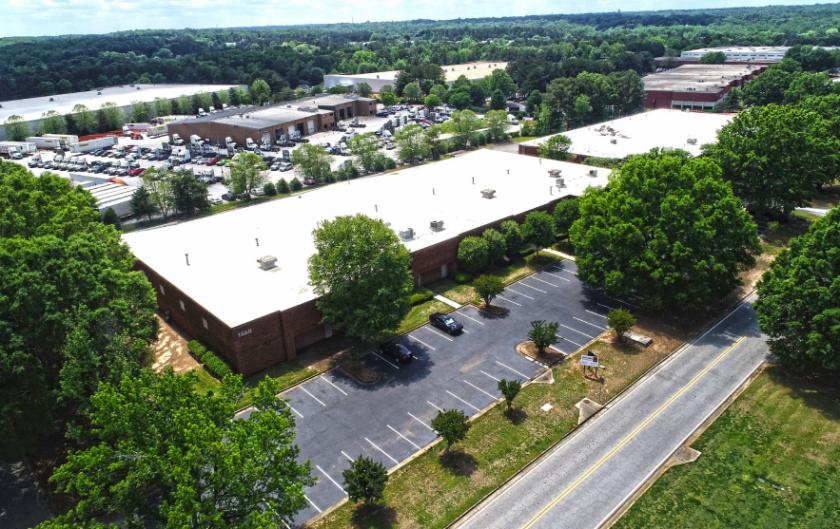
1560 Westfork Drive Lithia Springs, GA 30122
1560 Westfork Drive Lithia Springs, GA 30122
Details & Description
Listing Agents

Jordan Camp
Foundry Commercial
O: 404-649-6920
JORDAN.CAMP@FOUNDRYCOMMERCIAL.COM
Foundry Commercial
O: 404-649-6920
JORDAN.CAMP@FOUNDRYCOMMERCIAL.COM
While we strive to provide the most accurate information, all listing information, and demographic data, is provided by third-parties. As such, MyEListing will not be responsible for the accuracy of the information. It is strongly recommended that you verify all information with the listing agent, and any relevant agencies, prior to making any decisions.