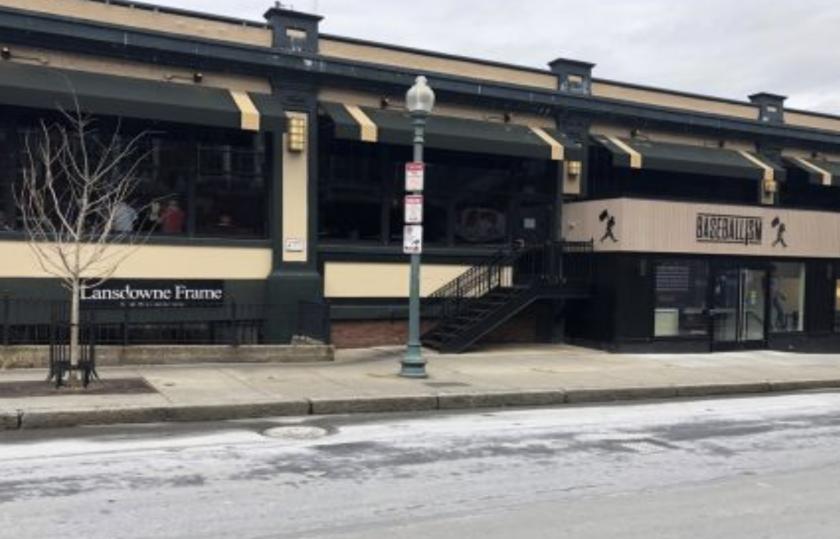
1-Mile | 3-Miles | 5-Miles | ||
---|---|---|---|---|
Total Population | 81,350 | 539,263 | 1,031,554 | |
Population Median Age | 30 | 36 | 36 | |
Population by Age | 0-9 Yrs | 2322 (2%) | 40589 (7%) | 92701 (8%) |
10-19 Yrs | 18715 (23%) | 57538 (10%) | 111477 (10%) | |
20-29 Yrs | 34284 (42%) | 161841 (30%) | 261036 (25%) | |
30-39 Yrs | 10219 (12%) | 97598 (18%) | 186921 (18%) | |
40-49 Yrs | 4436 (5%) | 50472 (9%) | 108978 (10%) | |
50-59 Yrs | 4062 (4%) | 48511 (8%) | 104416 (10%) | |
60-69 Yrs | 3628 (4%) | 41117 (7%) | 84909 (8%) | |
70+ Yrs | 3685 (4%) | 41596 (7%) | 81116 (7%) | |
Median HH Income | $60,760 | $81,276 | $83,081 | |
Total Household Income | < 24K | 8197 (30%) | 51860 (23%) | 84296 (20%) |
25-49K | 3656 (13%) | 28537 (12%) | 55825 (13%) | |
50-74K | 3019 (11%) | 26668 (11%) | 51246 (12%) | |
75-99K | 2136 (7%) | 22293 (9%) | 44064 (10%) | |
100-199K | 5899 (22%) | 57489 (25%) | 111379 (27%) | |
200K+ | 3834 (14%) | 38480 (17%) | 64413 (15%) | |
Highest Education Level | No Diploma | 2596 | 33469 | 76827 |
Diploma or GED | 2989 | 44675 | 114737 | |
Some College | 2975 | 33718 | 76893 | |
Assoc. Degree | 1154 | 11567 | 27409 | |
Bachelors Degree | 12679 | 114838 | 202000 | |
Higher Degree | 15528 | 130535 | 216594 | |
Total Housing Units | 30,273 | 248,401 | 448,271 | |
--Owner-Occupied | 4,923 | 70,400 | 146,726 | |
--Renter-Occupied | 21,817 | 154,926 | 264,497 | |
Owner-Occupied Values | < 100K | 120 | 994 | 2473 |
100-199K | 44 | 1028 | 2393 | |
200-299K | 139 | 2883 | 8532 | |
300-399K | 240 | 5918 | 16932 | |
400-499K | 424 | 7707 | 20550 | |
500K+ | 3957 | 51870 | 95846 | |
Total Working Age Population | 78,086 | 479,410 | 890,374 | |
In Work Force | 47,396 | 332,056 | 629,406 | |
Not In Work Force | 30,690 | 147,354 | 260,968 | |
Workforce Employed | 42,883 | 313,394 | 594,760 | |
Workforce Unemployed | 4,491 | 18,214 | 33,421 | |
Civlian Workforce | 47,373 | 331,608 | 628,182 | |
Military Workforce | 23 | 447 | 1,225 | |
Total Households | 26,741 | 225,327 | 411,223 | |
Family Households | 7,488 | 90,656 | 193,763 | |
Non-Family Households | 19,253 | 134,671 | 217,460 | |
Married Couple | 5,452 | 62,378 | 128,168 | |
Other Family | 2,036 | 28,277 | 65,594 | |
Married w/Child | 1,282 | 20,984 | 48,266 | |
Single Male w/Child | 193 | 2,297 | 5,702 | |
Single Female w/Child | 532 | 11,114 | 25,048 |
Population Change Last Two Decades - Plus Projection
2000 | % | 2010 | % | 2020 | % | 2030 | |
---|---|---|---|---|---|---|---|
Massachusetts | 6,349,097 | +3 | 6,547,629 | +6 | 6,933,887 | +4 | 7,225,472 |
Essex County | 723,419 | +3 | 743,159 | +6 | 790,035 | +3 | 816,022 |
Middlesex County | 1,465,396 | +3 | 1,503,085 | +7 | 1,613,961 | +5 | 1,686,641 |
Norfolk County | 650,308 | +3 | 670,850 | +7 | 718,394 | +7 | 765,912 |
Plymouth County | 472,822 | +5 | 494,919 | +5 | 518,508 | +3 | 534,464 |
Suffolk County | 689,807 | +5 | 722,023 | +14 | 821,840 | +10 | 900,586 |
Total Working Age Population:
Total Households:
Total Working Age Population:
Total Households:
Total Working Age Population:
Total Households: