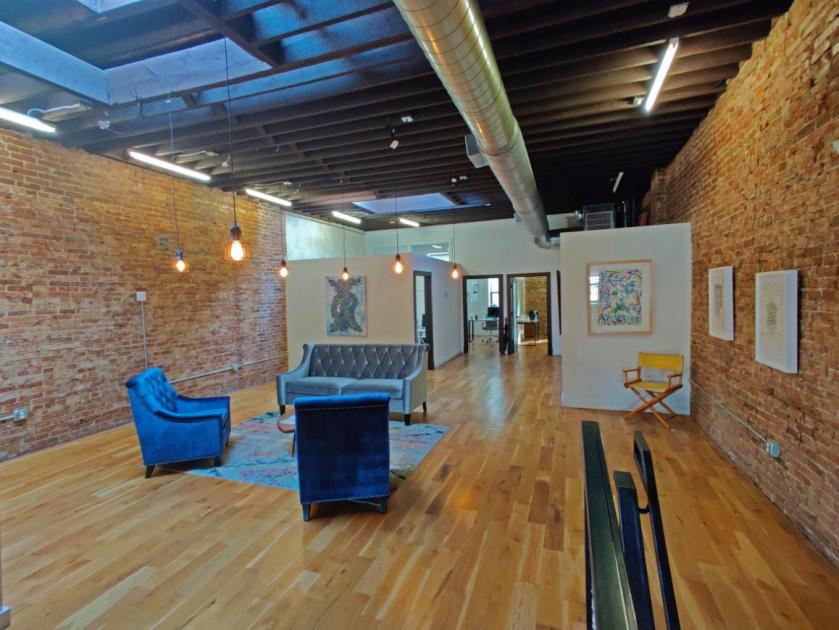
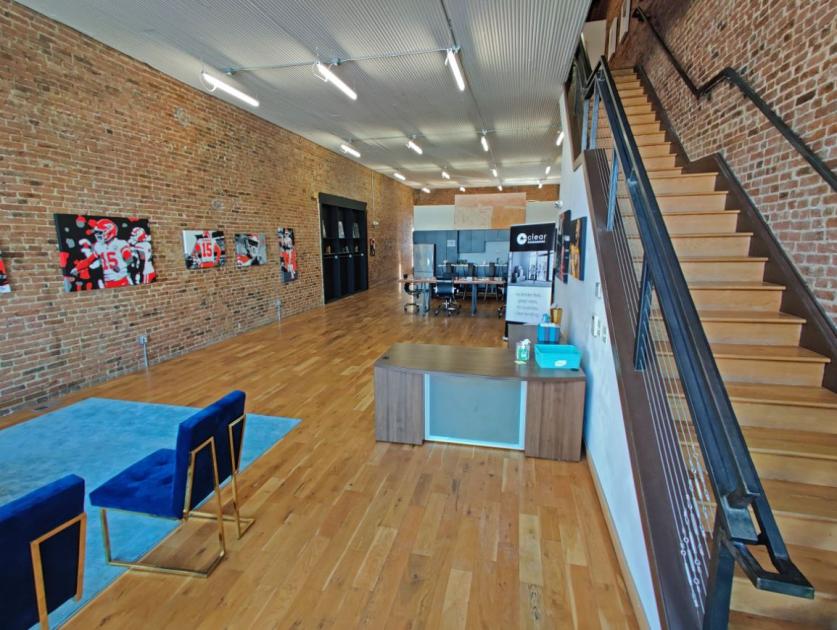
1-Mile | 3-Miles | 5-Miles | ||
---|---|---|---|---|
Total Population | 9,575 | 95,915 | 232,136 | |
Population Median Age | 37 | 36 | 36 | |
Population by Age | 0-9 Yrs | 617 (6%) | 10916 (11%) | 30676 (13%) |
10-19 Yrs | 366 (3%) | 8632 (8%) | 27894 (12%) | |
20-29 Yrs | 3466 (36%) | 23205 (24%) | 45415 (19%) | |
30-39 Yrs | 1692 (17%) | 16501 (17%) | 35389 (15%) | |
40-49 Yrs | 1077 (11%) | 11057 (11%) | 26640 (11%) | |
50-59 Yrs | 918 (9%) | 11348 (11%) | 27790 (11%) | |
60-69 Yrs | 909 (9%) | 8319 (8%) | 22128 (9%) | |
70+ Yrs | 530 (5%) | 5936 (6%) | 16204 (6%) | |
Median HH Income | $58,321 | $40,207 | $41,648 | |
Total Household Income | < 24K | 1227 (22%) | 15171 (33%) | 31342 (31%) |
25-49K | 1059 (19%) | 11713 (25%) | 26948 (27%) | |
50-74K | 1137 (20%) | 7898 (17%) | 16463 (16%) | |
75-99K | 721 (13%) | 4220 (9%) | 8976 (8%) | |
100-199K | 966 (17%) | 5376 (11%) | 12322 (12%) | |
200K+ | 322 (5%) | 1136 (2%) | 3746 (3%) | |
Highest Education Level | No Diploma | 660 | 11301 | 28780 |
Diploma or GED | 1086 | 16253 | 40723 | |
Some College | 1123 | 12187 | 29353 | |
Assoc. Degree | 374 | 3820 | 8469 | |
Bachelors Degree | 2384 | 14247 | 28394 | |
Higher Degree | 1793 | 9366 | 18676 | |
Total Housing Units | 6,127 | 55,057 | 121,175 | |
--Owner-Occupied | 1,468 | 14,072 | 41,898 | |
--Renter-Occupied | 3,966 | 31,443 | 57,899 | |
Owner-Occupied Values | < 100K | 255 | 6195 | 21301 |
100-199K | 449 | 4380 | 10316 | |
200-299K | 348 | 1758 | 4031 | |
300-399K | 176 | 901 | 2154 | |
400-499K | 82 | 283 | 1163 | |
500K+ | 157 | 554 | 2934 | |
Total Working Age Population | 8,773 | 79,782 | 184,463 | |
In Work Force | 6,593 | 54,090 | 122,120 | |
Not In Work Force | 2,180 | 25,691 | 62,342 | |
Workforce Employed | 6,284 | 50,994 | 115,170 | |
Workforce Unemployed | 304 | 2,999 | 6,835 | |
Civlian Workforce | 6,589 | 53,993 | 122,005 | |
Military Workforce | 4 | 97 | 116 | |
Total Households | 5,434 | 45,515 | 99,798 | |
Family Households | 1,511 | 16,814 | 45,599 | |
Non-Family Households | 3,923 | 28,700 | 54,199 | |
Married Couple | 1,020 | 9,216 | 26,710 | |
Other Family | 491 | 7,598 | 18,889 | |
Married w/Child | 247 | 3,418 | 11,072 | |
Single Male w/Child | 54 | 671 | 2,011 | |
Single Female w/Child | 200 | 3,244 | 7,922 |
Population Change Last Two Decades - Plus Projection
2000 | % | 2010 | % | 2020 | % | 2030 | |
---|---|---|---|---|---|---|---|
Kansas | 2,688,418 | +6 | 2,853,118 | +5 | 2,988,194 | +5 | 3,140,008 |
Johnson County | 451,086 | +21 | 544,179 | +15 | 625,524 | +17 | 734,065 |
Wyandotte County | 157,882 | 0 | 157,505 | +5 | 165,672 | +2 | 169,789 |
Missouri | 5,595,211 | +7 | 5,988,927 | +7 | 6,389,850 | +6 | 6,746,762 |
Clay County | 184,006 | +21 | 221,939 | +18 | 261,469 | +15 | 300,021 |
Jackson County | 654,880 | +3 | 674,158 | +2 | 689,226 | +4 | 714,467 |
Platte County | 73,781 | +21 | 89,322 | +15 | 102,810 | +12 | 114,904 |
Total Working Age Population:
Total Households:
Total Working Age Population:
Total Households:
Total Working Age Population:
Total Households: