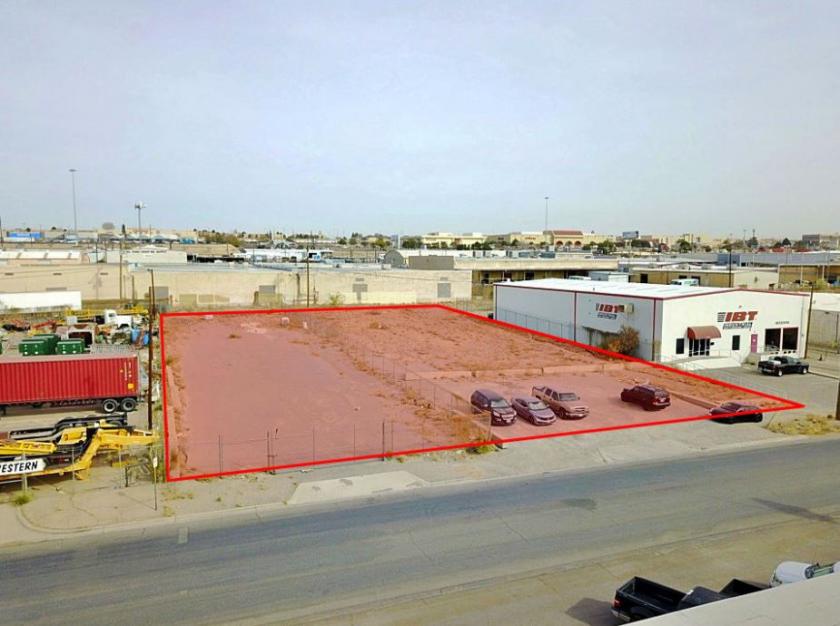
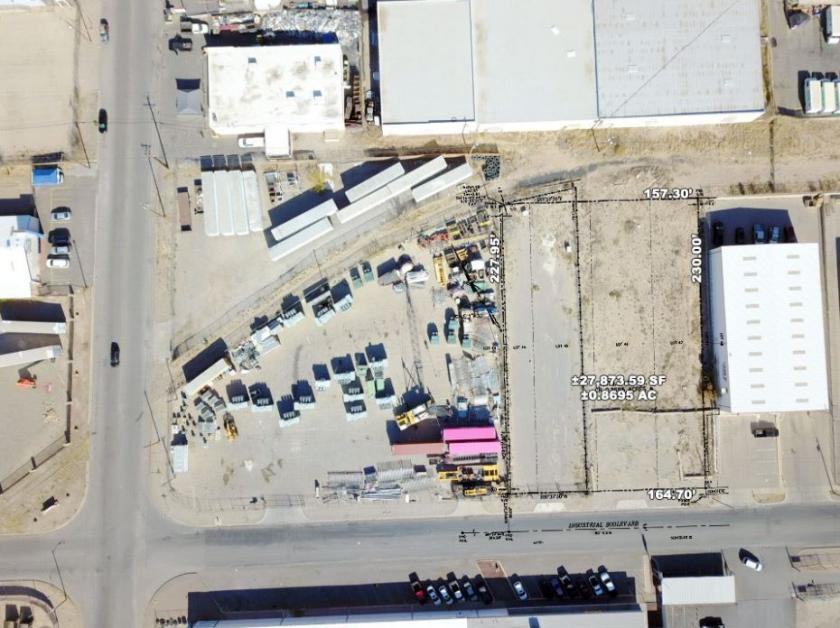
• Total Land Area: 0.8695 AC (37,873.59 SF – Dimensions: ±161’ X ±229’)
• Partially fenced ±16,091 SF
• Partially paved
• All city utlities
• Zoning: M-1
• Level site (partially graded)
• Established Industrial/Trade Area
• Across from Cielo Vista Mall, The Fountains at Farah, & other Major Developments
• Central location with Easy Access to Interstate 10 and EL Paso International Airport
• One of the last undeveloped parcels of land available in the Eastside Industrial Park
No part of this information may be copied, reproduced, repurposed, or screen-captured for any commercial purpose without prior written authorization from MyEListing.
While we strive to provide the most accurate information, all listing information, and demographic data, is provided by third-parties. As such, MyEListing will not be responsible for the accuracy of the information. It is strongly recommended that you verify all information with the listing agent, and any relevant agencies, prior to making any decisions.
How much land does the El Paso, TX property at 6907 Industrial Avenue include?
6907 Industrial Avenue in El Paso includes 0.870 acres of land
What kind of Land is the propery at 6907 Industrial Avenue?
The property at 6907 Industrial Avenue El Paso, TX 79915 is listed as a Mixed Use Land Land property
What is the population within 1 mile of 6907 Industrial Avenue in El Paso?
The population within 1 mile of 6907 Industrial Avenue El Paso, TX 79915 is 5,594 people.
Who do I contact for questions about 6907 Industrial Avenue?
You should contact the listing agent,
Erik Anderson, for any details regarding this commercial listing.