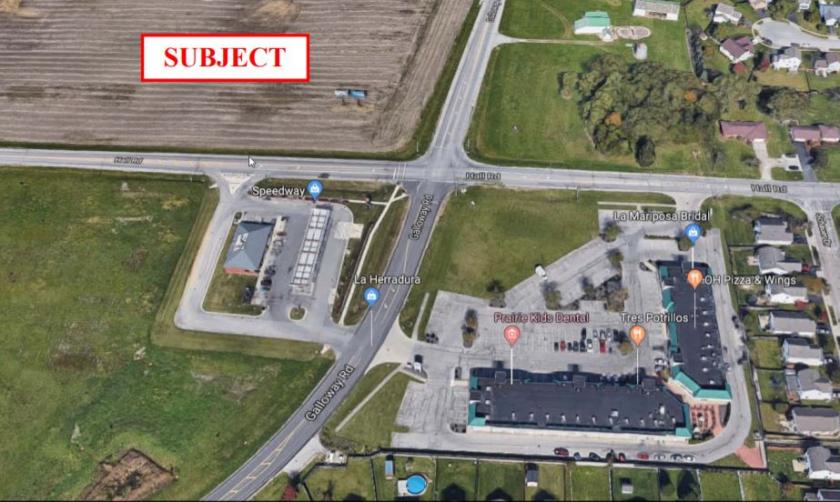
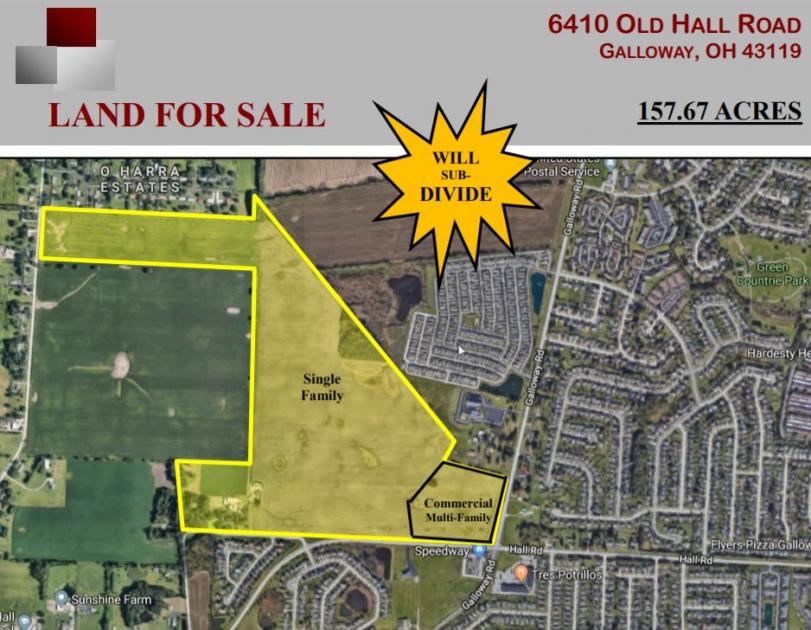
1-Mile | 3-Miles | 5-Miles | ||
---|---|---|---|---|
Total Population | 4,917 | 56,501 | 125,707 | |
Population Median Age | 37 | 35 | 35 | |
Population by Age | 0-9 Yrs | 711 (14%) | 8697 (15%) | 19028 (15%) |
10-19 Yrs | 500 (10%) | 7566 (13%) | 16694 (13%) | |
20-29 Yrs | 649 (13%) | 8782 (15%) | 18213 (14%) | |
30-39 Yrs | 811 (16%) | 8776 (15%) | 20031 (15%) | |
40-49 Yrs | 614 (12%) | 7352 (13%) | 16421 (13%) | |
50-59 Yrs | 839 (17%) | 7171 (12%) | 16219 (12%) | |
60-69 Yrs | 470 (9%) | 4893 (8%) | 11491 (9%) | |
70+ Yrs | 322 (6%) | 3264 (5%) | 7609 (6%) | |
Median HH Income | $63,657 | $53,455 | $56,719 | |
Total Household Income | < 24K | 198 (10%) | 4021 (18%) | 9217 (19%) |
25-49K | 429 (22%) | 5841 (27%) | 11670 (24%) | |
50-74K | 490 (25%) | 5246 (24%) | 10718 (22%) | |
75-99K | 368 (19%) | 2850 (13%) | 6799 (14%) | |
100-199K | 410 (21%) | 3278 (15%) | 8989 (18%) | |
200K+ | 19 (0%) | 303 (1%) | 928 (1%) | |
Highest Education Level | No Diploma | 202 | 5103 | 9930 |
Diploma or GED | 1185 | 11704 | 25965 | |
Some College | 893 | 7986 | 17776 | |
Assoc. Degree | 374 | 3413 | 7347 | |
Bachelors Degree | 557 | 6001 | 15341 | |
Higher Degree | 238 | 2416 | 6437 | |
Total Housing Units | 1,979 | 22,957 | 51,369 | |
--Owner-Occupied | 1,411 | 10,867 | 27,051 | |
--Renter-Occupied | 503 | 10,672 | 21,270 | |
Owner-Occupied Values | < 100K | 183 | 2685 | 5848 |
100-199K | 1095 | 6337 | 15659 | |
200-299K | 57 | 1336 | 4244 | |
300-399K | 25 | 307 | 777 | |
400-499K | 48 | 92 | 236 | |
500K+ | 3 | 110 | 287 | |
Total Working Age Population | 3,853 | 43,018 | 96,089 | |
In Work Force | 2,815 | 30,670 | 68,170 | |
Not In Work Force | 1,039 | 12,348 | 27,919 | |
Workforce Employed | 2,637 | 29,326 | 65,343 | |
Workforce Unemployed | 163 | 1,329 | 2,768 | |
Civlian Workforce | 2,800 | 30,655 | 68,111 | |
Military Workforce | 15 | 15 | 59 | |
Total Households | 1,915 | 21,539 | 48,320 | |
Family Households | 1,275 | 13,457 | 30,972 | |
Non-Family Households | 639 | 8,082 | 17,348 | |
Married Couple | 933 | 8,580 | 20,567 | |
Other Family | 342 | 4,877 | 10,405 | |
Married w/Child | 352 | 3,850 | 8,980 | |
Single Male w/Child | 59 | 752 | 1,550 | |
Single Female w/Child | 116 | 1,867 | 4,164 |
Population Change Last Two Decades - Plus Projection
2000 | % | 2010 | % | 2020 | % | 2030 | |
---|---|---|---|---|---|---|---|
Ohio | 11,353,140 | +2 | 11,536,504 | 0 | 11,574,870 | 0 | 11,615,100 |
Franklin County | 1,068,978 | +9 | 1,163,414 | +11 | 1,291,320 | +8 | 1,394,980 |
Madison County | 40,213 | +8 | 43,435 | +5 | 45,670 | +4 | 47,420 |
Total Working Age Population:
Total Households:
Total Working Age Population:
Total Households:
Total Working Age Population:
Total Households: