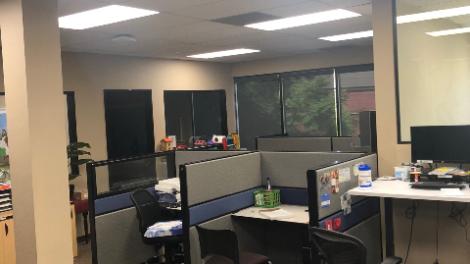
1-Mile | 3-Miles | 5-Miles | ||
---|---|---|---|---|
Total Population | 25,366 | 206,734 | 517,518 | |
Population Median Age | 39 | 39 | 39 | |
Population by Age | 0-9 Yrs | 3737 (14%) | 25499 (12%) | 63669 (12%) |
10-19 Yrs | 2483 (9%) | 24320 (11%) | 60986 (11%) | |
20-29 Yrs | 2575 (10%) | 23286 (11%) | 64177 (12%) | |
30-39 Yrs | 3575 (14%) | 30414 (14%) | 81255 (15%) | |
40-49 Yrs | 4095 (16%) | 32687 (15%) | 76766 (14%) | |
50-59 Yrs | 3568 (14%) | 29495 (14%) | 70540 (13%) | |
60-69 Yrs | 2765 (10%) | 20668 (9%) | 50279 (9%) | |
70+ Yrs | 2568 (10%) | 20365 (9%) | 49846 (9%) | |
Median HH Income | $125,150 | $131,878 | $131,294 | |
Total Household Income | < 24K | 973 (10%) | 7316 (9%) | 17197 (9%) |
25-49K | 921 (10%) | 7342 (9%) | 19650 (10%) | |
50-74K | 1050 (11%) | 7805 (10%) | 19147 (10%) | |
75-99K | 952 (10%) | 7098 (9%) | 18556 (9%) | |
100-199K | 2464 (27%) | 22245 (29%) | 55768 (29%) | |
200K+ | 2599 (29%) | 23212 (30%) | 58227 (30%) | |
Highest Education Level | No Diploma | 1153 | 8253 | 22555 |
Diploma or GED | 2488 | 17355 | 42471 | |
Some College | 2919 | 20827 | 50676 | |
Assoc. Degree | 1005 | 9464 | 23653 | |
Bachelors Degree | 5751 | 47017 | 116802 | |
Higher Degree | 4853 | 44802 | 109991 | |
Total Housing Units | 9,381 | 80,278 | 199,877 | |
--Owner-Occupied | 4,759 | 41,216 | 99,925 | |
--Renter-Occupied | 4,200 | 33,803 | 88,619 | |
Owner-Occupied Values | < 100K | 12 | 405 | 1228 |
100-199K | 40 | 442 | 870 | |
200-299K | 6 | 282 | 602 | |
300-399K | 20 | 519 | 1021 | |
400-499K | 21 | 602 | 1685 | |
500K+ | 4659 | 38966 | 94519 | |
Total Working Age Population | 19,769 | 165,397 | 416,275 | |
In Work Force | 13,331 | 109,620 | 278,183 | |
Not In Work Force | 6,438 | 55,777 | 138,092 | |
Workforce Employed | 12,822 | 105,547 | 267,929 | |
Workforce Unemployed | 506 | 3,938 | 10,046 | |
Civlian Workforce | 13,328 | 109,485 | 277,975 | |
Military Workforce | 2 | 135 | 208 | |
Total Households | 8,959 | 75,019 | 188,544 | |
Family Households | 6,617 | 53,798 | 132,171 | |
Non-Family Households | 2,342 | 21,220 | 56,373 | |
Married Couple | 5,329 | 43,874 | 108,250 | |
Other Family | 1,288 | 9,924 | 23,922 | |
Married w/Child | 2,863 | 22,038 | 53,104 | |
Single Male w/Child | 125 | 1,186 | 3,180 | |
Single Female w/Child | 331 | 2,945 | 7,152 |
Population Change Last Two Decades - Plus Projection
2000 | % | 2010 | % | 2020 | % | 2030 | |
---|---|---|---|---|---|---|---|
California | 33,871,648 | +10 | 37,253,956 | +9 | 40,467,295 | +8 | 43,631,295 |
Santa Clara County | 1,682,585 | +6 | 1,781,642 | +12 | 1,996,394 | +10 | 2,194,079 |
Santa Cruz County | 255,602 | +3 | 262,382 | +6 | 278,997 | +6 | 296,728 |
Total Working Age Population:
Total Households:
Total Working Age Population:
Total Households:
Total Working Age Population:
Total Households: