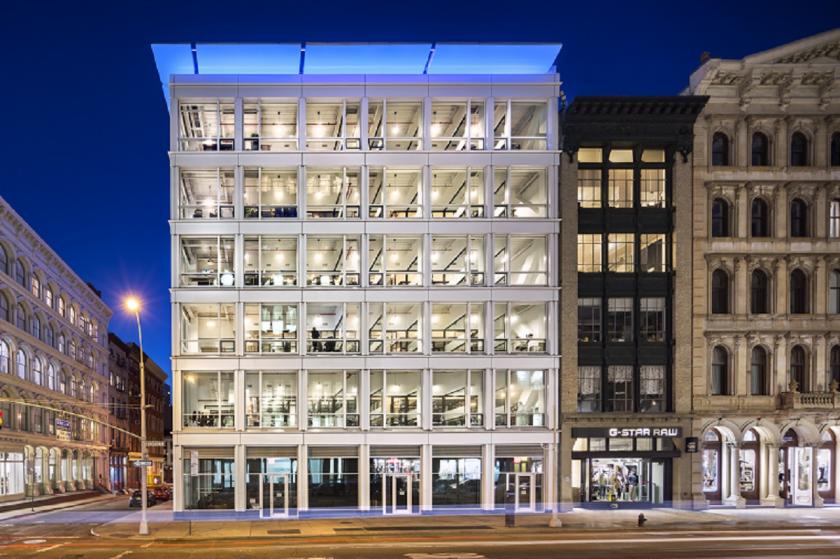
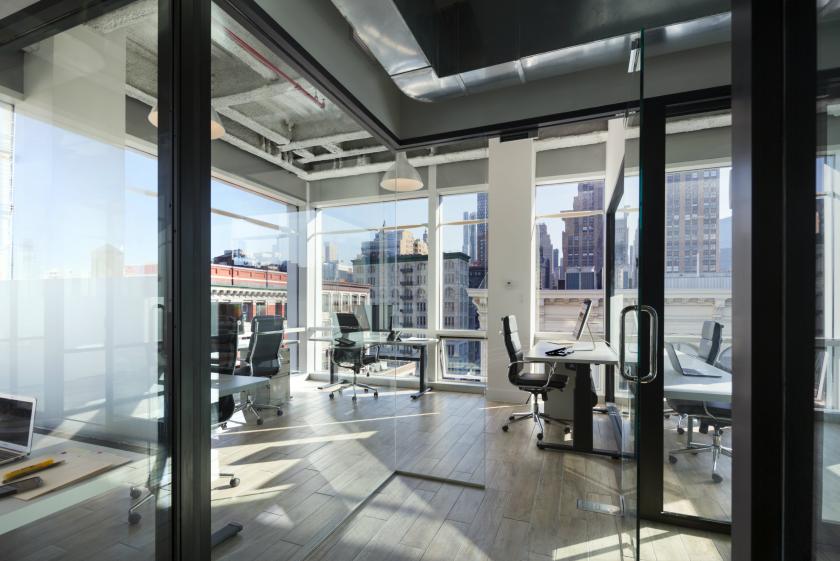
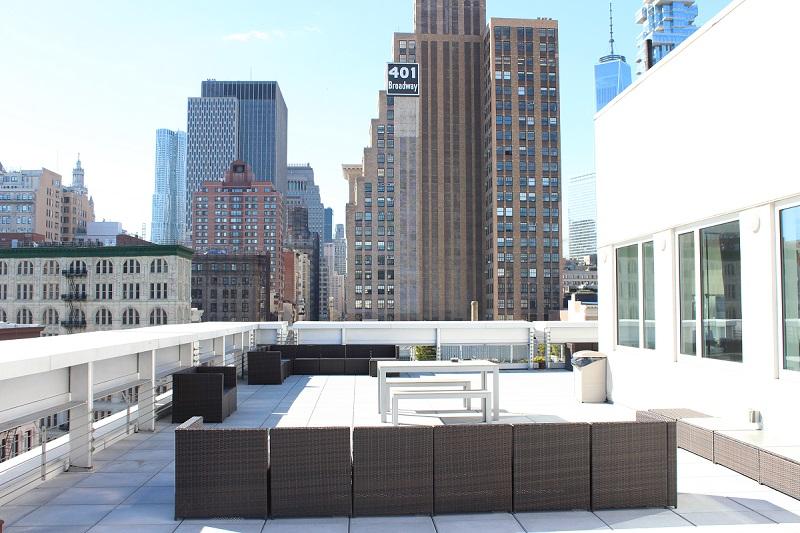
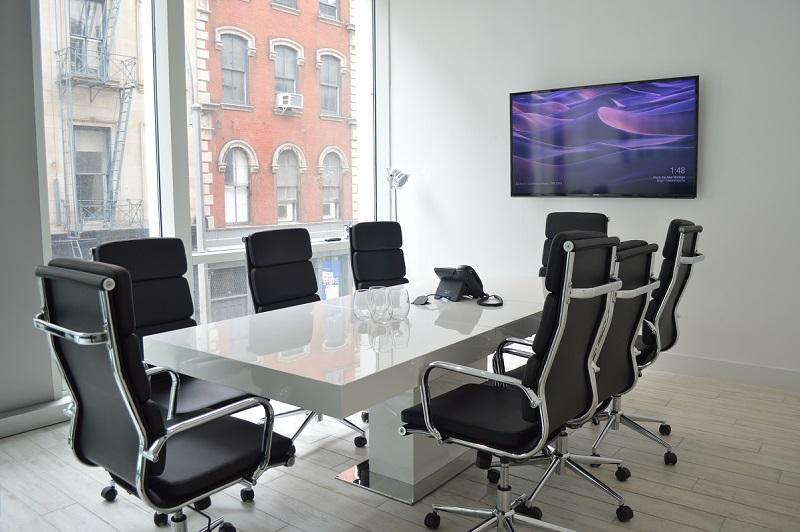
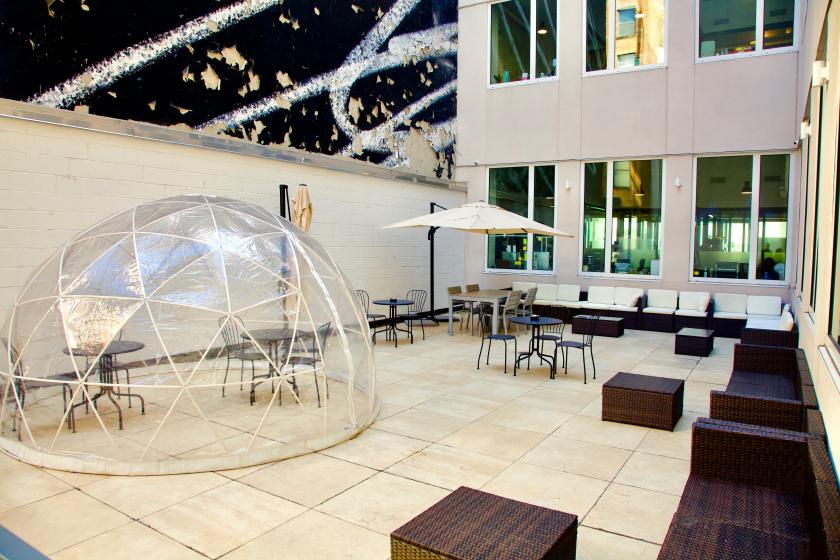
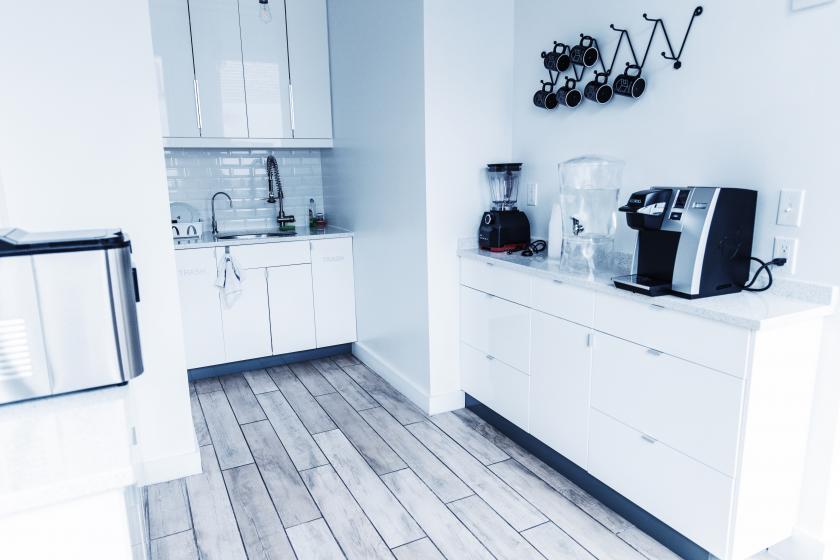
1-Mile | 3-Miles | 5-Miles | ||
---|---|---|---|---|
Total Population | 192,726 | 1,059,527 | 2,463,492 | |
Population Median Age | 41 | 37 | 38 | |
Population by Age | 0-9 Yrs | 14198 (7%) | 105543 (9%) | 262125 (10%) |
10-19 Yrs | 12900 (6%) | 76230 (7%) | 196790 (7%) | |
20-29 Yrs | 39609 (20%) | 217195 (20%) | 457068 (18%) | |
30-39 Yrs | 37713 (19%) | 248903 (23%) | 522914 (21%) | |
40-49 Yrs | 24005 (12%) | 135666 (12%) | 323073 (13%) | |
50-59 Yrs | 20497 (10%) | 102589 (9%) | 263236 (10%) | |
60-69 Yrs | 20532 (10%) | 88988 (8%) | 219527 (8%) | |
70+ Yrs | 23272 (12%) | 84413 (7%) | 218760 (8%) | |
Median HH Income | $93,608 | $112,120 | $94,192 | |
Total Household Income | < 24K | 19304 (21%) | 84961 (16%) | 200705 (18%) |
25-49K | 11446 (12%) | 53906 (10%) | 143985 (13%) | |
50-74K | 9114 (9%) | 46842 (9%) | 125025 (11%) | |
75-99K | 7692 (8%) | 45001 (8%) | 109080 (9%) | |
100-199K | 20597 (22%) | 132164 (26%) | 278112 (25%) | |
200K+ | 23027 (25%) | 138993 (27%) | 250014 (22%) | |
Highest Education Level | No Diploma | 25730 | 76115 | 206802 |
Diploma or GED | 15766 | 83561 | 272372 | |
Some College | 10458 | 64650 | 178013 | |
Assoc. Degree | 4299 | 23050 | 71190 | |
Bachelors Degree | 54064 | 307820 | 610694 | |
Higher Degree | 40561 | 251565 | 510398 | |
Total Housing Units | 104,867 | 569,467 | 1,263,898 | |
--Owner-Occupied | 19,336 | 126,124 | 295,028 | |
--Renter-Occupied | 71,844 | 375,742 | 811,894 | |
Owner-Occupied Values | < 100K | 739 | 4217 | 8144 |
100-199K | 240 | 3113 | 8413 | |
200-299K | 234 | 3423 | 13987 | |
300-399K | 410 | 5658 | 19133 | |
400-499K | 868 | 7544 | 19490 | |
500K+ | 16844 | 102169 | 225861 | |
Total Working Age Population | 172,275 | 913,109 | 2,084,771 | |
In Work Force | 113,576 | 661,267 | 1,472,943 | |
Not In Work Force | 58,699 | 251,842 | 611,828 | |
Workforce Employed | 108,353 | 633,687 | 1,403,802 | |
Workforce Unemployed | 5,201 | 27,391 | 68,598 | |
Civlian Workforce | 113,554 | 661,078 | 1,472,399 | |
Military Workforce | 22 | 188 | 544 | |
Total Households | 91,180 | 501,867 | 1,106,921 | |
Family Households | 36,977 | 209,070 | 519,664 | |
Non-Family Households | 54,203 | 292,797 | 587,258 | |
Married Couple | 27,895 | 161,123 | 367,560 | |
Other Family | 9,082 | 47,947 | 152,104 | |
Married w/Child | 9,327 | 63,698 | 149,120 | |
Single Male w/Child | 796 | 4,182 | 13,322 | |
Single Female w/Child | 1,963 | 14,800 | 48,339 |
Population Change Last Two Decades - Plus Projection
2000 | % | 2010 | % | 2020 | % | 2030 | |
---|---|---|---|---|---|---|---|
New Jersey | 8,414,350 | +4 | 8,791,894 | +4 | 9,132,700 | +4 | 9,530,900 |
Bergen County | 884,118 | +2 | 905,116 | +7 | 967,500 | +7 | 1,031,500 |
Hudson County | 608,975 | +4 | 634,266 | +12 | 708,100 | +6 | 747,400 |
New York | 18,976,457 | +2 | 19,378,102 | +4 | 20,146,131 | +2 | 20,604,030 |
Kings County | 2,465,326 | +2 | 2,504,700 | +9 | 2,738,283 | +5 | 2,863,996 |
New York County | 1,537,195 | +3 | 1,585,873 | +6 | 1,688,894 | +2 | 1,727,631 |
Queens County | 2,229,379 | 0 | 2,230,722 | +9 | 2,436,549 | +5 | 2,565,268 |
Total Working Age Population:
Total Households:
Total Working Age Population:
Total Households:
Total Working Age Population:
Total Households: