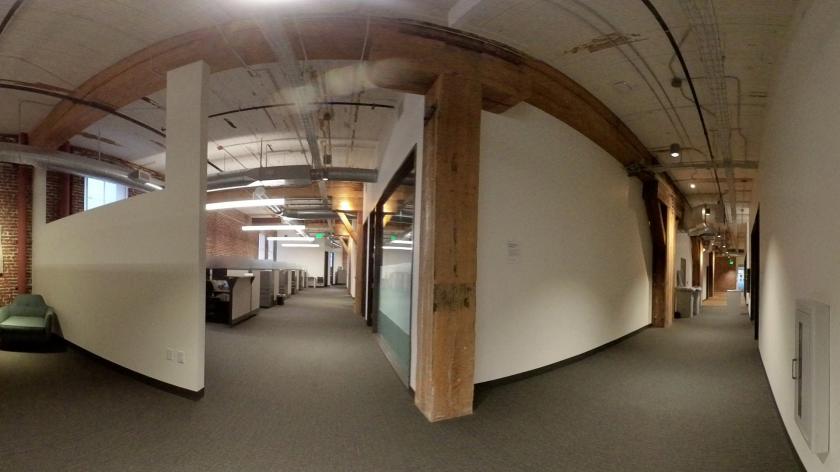
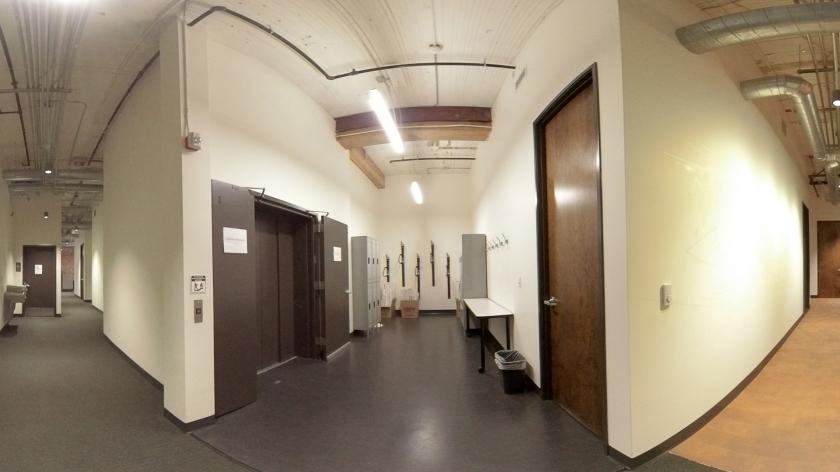
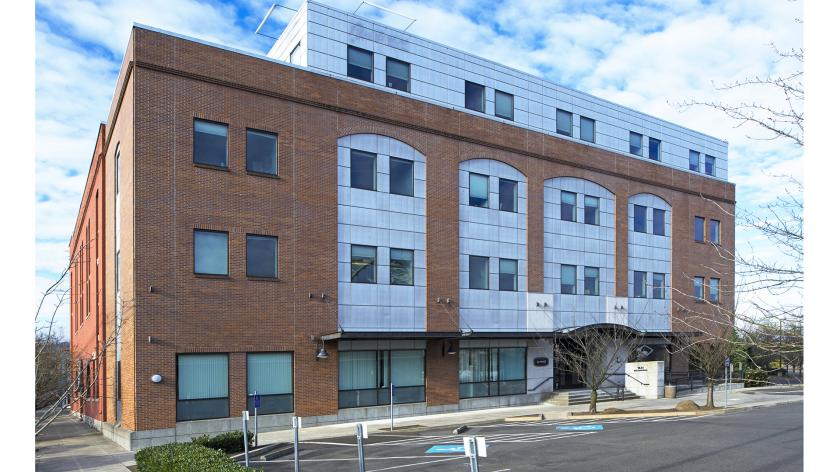
1-Mile | 3-Miles | 5-Miles | ||
---|---|---|---|---|
Total Population | 31,021 | 169,395 | 402,223 | |
Population Median Age | 42 | 40 | 39 | |
Population by Age | 0-9 Yrs | 1094 (3%) | 11443 (6%) | 36796 (9%) |
10-19 Yrs | 972 (3%) | 11024 (6%) | 34242 (8%) | |
20-29 Yrs | 6515 (21%) | 33768 (19%) | 67321 (16%) | |
30-39 Yrs | 8158 (26%) | 38428 (22%) | 82660 (20%) | |
40-49 Yrs | 3980 (12%) | 24487 (14%) | 60782 (15%) | |
50-59 Yrs | 3685 (11%) | 18589 (10%) | 45804 (11%) | |
60-69 Yrs | 4428 (14%) | 18447 (10%) | 42478 (10%) | |
70+ Yrs | 2190 (7%) | 13209 (7%) | 32139 (7%) | |
Median HH Income | $65,480 | $70,960 | $78,999 | |
Total Household Income | < 24K | 5021 (25%) | 18358 (21%) | 30529 (16%) |
25-49K | 3470 (17%) | 14197 (16%) | 29204 (16%) | |
50-74K | 2284 (11%) | 12268 (14%) | 27236 (15%) | |
75-99K | 1624 (8%) | 9428 (10%) | 21813 (12%) | |
100-199K | 5546 (27%) | 20916 (24%) | 48589 (26%) | |
200K+ | 2019 (10%) | 10821 (12%) | 23548 (13%) | |
Highest Education Level | No Diploma | 510 | 4421 | 12177 |
Diploma or GED | 2806 | 13201 | 31549 | |
Some College | 4260 | 23496 | 54724 | |
Assoc. Degree | 1353 | 6947 | 17371 | |
Bachelors Degree | 11492 | 51242 | 110393 | |
Higher Degree | 7037 | 36709 | 80583 | |
Total Housing Units | 22,538 | 93,993 | 194,242 | |
--Owner-Occupied | 4,768 | 32,051 | 89,402 | |
--Renter-Occupied | 15,197 | 53,937 | 91,517 | |
Owner-Occupied Values | < 100K | 28 | 336 | 1183 |
100-199K | 83 | 477 | 1851 | |
200-299K | 432 | 2358 | 7392 | |
300-399K | 846 | 4790 | 15424 | |
400-499K | 706 | 5753 | 18191 | |
500K+ | 2673 | 18337 | 45361 | |
Total Working Age Population | 29,402 | 151,773 | 345,715 | |
In Work Force | 20,926 | 109,741 | 248,618 | |
Not In Work Force | 8,476 | 42,032 | 97,098 | |
Workforce Employed | 20,142 | 104,907 | 238,074 | |
Workforce Unemployed | 777 | 4,768 | 10,452 | |
Civlian Workforce | 20,919 | 109,675 | 248,526 | |
Military Workforce | 7 | 66 | 92 | |
Total Households | 19,965 | 85,989 | 180,919 | |
Family Households | 4,745 | 30,734 | 82,628 | |
Non-Family Households | 15,219 | 55,254 | 98,291 | |
Married Couple | 4,085 | 25,074 | 66,015 | |
Other Family | 660 | 5,661 | 16,613 | |
Married w/Child | 729 | 8,244 | 26,211 | |
Single Male w/Child | 113 | 750 | 2,396 | |
Single Female w/Child | 289 | 2,294 | 6,230 |
Population Change Last Two Decades - Plus Projection
2000 | % | 2010 | % | 2020 | % | 2030 | |
---|---|---|---|---|---|---|---|
Oregon | 3,421,399 | +12 | 3,831,074 | +11 | 4,264,810 | +11 | 4,727,438 |
Multnomah County | 660,486 | +11 | 735,334 | +12 | 822,675 | +10 | 906,904 |
Washington County | 445,342 | +19 | 529,710 | +17 | 619,337 | +16 | 718,633 |
Washington | 5,894,121 | +14 | 6,724,540 | +14 | 7,638,415 | +11 | 8,503,178 |
Clark County | 345,238 | +23 | 425,363 | +17 | 499,400 | +16 | 576,879 |
Total Working Age Population:
Total Households:
Total Working Age Population:
Total Households:
Total Working Age Population:
Total Households: