Commercial Land
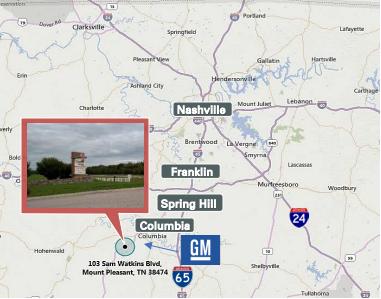
103 Sam Watkins Boulevard Mount Pleasant, TN 38474
103 Sam Watkins Boulevard Mount Pleasant, TN 38474
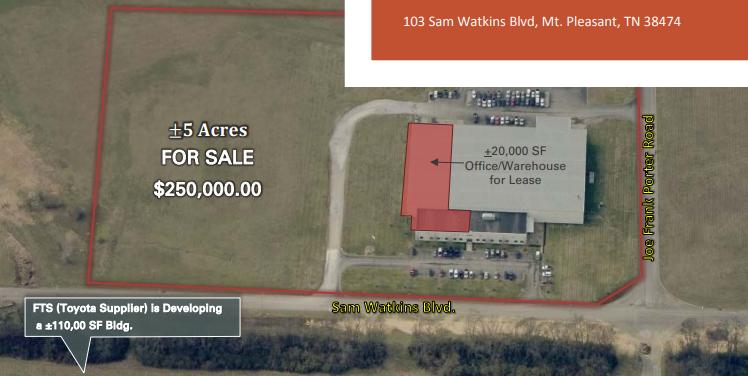
Details & Description
Listing Agents

Jeff Thomas
O: 615-345-7232
M: 615-417-3337
jthomas@charleshawkinsco.com
O: 615-345-7232
M: 615-417-3337
jthomas@charleshawkinsco.com
While we strive to provide the most accurate information, all listing information, and demographic data, is provided by third-parties. As such, MyEListing will not be responsible for the accuracy of the information. It is strongly recommended that you verify all information with the listing agent, and any relevant agencies, prior to making any decisions.