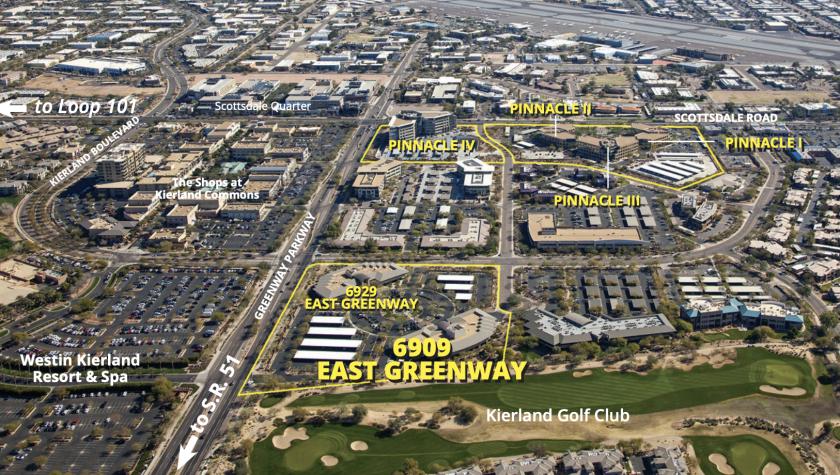
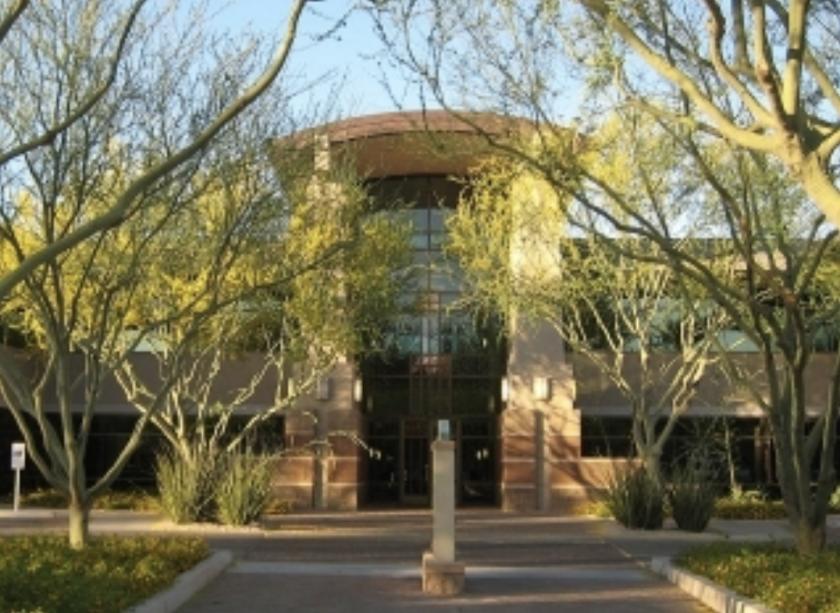
1-Mile | 3-Miles | 5-Miles | ||
---|---|---|---|---|
Total Population | 8,092 | 68,675 | 204,671 | |
Population Median Age | 45 | 43 | 43 | |
Population by Age | 0-9 Yrs | 832 (10%) | 6871 (10%) | 19898 (9%) |
10-19 Yrs | 686 (8%) | 7731 (11%) | 22380 (10%) | |
20-29 Yrs | 647 (7%) | 7125 (10%) | 21852 (10%) | |
30-39 Yrs | 1188 (14%) | 9004 (13%) | 26204 (12%) | |
40-49 Yrs | 1088 (13%) | 8593 (12%) | 27172 (13%) | |
50-59 Yrs | 1150 (14%) | 10166 (14%) | 30415 (14%) | |
60-69 Yrs | 1199 (14%) | 9698 (14%) | 27819 (13%) | |
70+ Yrs | 1302 (16%) | 9486 (13%) | 28931 (14%) | |
Median HH Income | $98,382 | $94,435 | $88,074 | |
Total Household Income | < 24K | 221 (6%) | 2546 (9%) | 9975 (11%) |
25-49K | 544 (16%) | 4276 (15%) | 14147 (16%) | |
50-74K | 517 (15%) | 4272 (15%) | 13269 (15%) | |
75-99K | 443 (13%) | 3899 (13%) | 11600 (13%) | |
100-199K | 1160 (34%) | 9089 (32%) | 24178 (27%) | |
200K+ | 508 (14%) | 4168 (14%) | 13747 (15%) | |
Highest Education Level | No Diploma | 150 | 1248 | 6668 |
Diploma or GED | 976 | 7153 | 21607 | |
Some College | 1211 | 10021 | 29231 | |
Assoc. Degree | 428 | 3983 | 11579 | |
Bachelors Degree | 2289 | 17681 | 49918 | |
Higher Degree | 1249 | 11266 | 33845 | |
Total Housing Units | 4,163 | 32,556 | 100,093 | |
--Owner-Occupied | 2,072 | 18,363 | 56,623 | |
--Renter-Occupied | 1,321 | 9,886 | 30,293 | |
Owner-Occupied Values | < 100K | 10 | 271 | 1367 |
100-199K | 111 | 571 | 4073 | |
200-299K | 125 | 1353 | 9130 | |
300-399K | 498 | 4158 | 11121 | |
400-499K | 534 | 4336 | 9533 | |
500K+ | 793 | 7676 | 21398 | |
Total Working Age Population | 6,863 | 57,016 | 170,722 | |
In Work Force | 4,399 | 37,564 | 110,539 | |
Not In Work Force | 2,464 | 19,451 | 60,183 | |
Workforce Employed | 4,286 | 36,314 | 106,467 | |
Workforce Unemployed | 113 | 1,238 | 4,023 | |
Civlian Workforce | 4,399 | 37,552 | 110,490 | |
Military Workforce | 0 | 12 | 49 | |
Total Households | 3,393 | 28,250 | 86,915 | |
Family Households | 2,190 | 17,779 | 52,565 | |
Non-Family Households | 1,203 | 10,470 | 34,350 | |
Married Couple | 1,833 | 14,770 | 42,249 | |
Other Family | 357 | 3,010 | 10,315 | |
Married w/Child | 619 | 5,435 | 14,839 | |
Single Male w/Child | 41 | 354 | 1,491 | |
Single Female w/Child | 88 | 1,157 | 3,518 |
Population Change Last Two Decades - Plus Projection
2000 | % | 2010 | % | 2020 | % | 2030 | |
---|---|---|---|---|---|---|---|
Arizona | 5,130,632 | +25 | 6,392,017 | +14 | 7,286,100 | +14 | 8,284,900 |
Maricopa County | 3,072,149 | +24 | 3,817,117 | +16 | 4,436,900 | +15 | 5,107,700 |
Total Working Age Population:
Total Households:
Total Working Age Population:
Total Households:
Total Working Age Population:
Total Households: