Industrial Properties
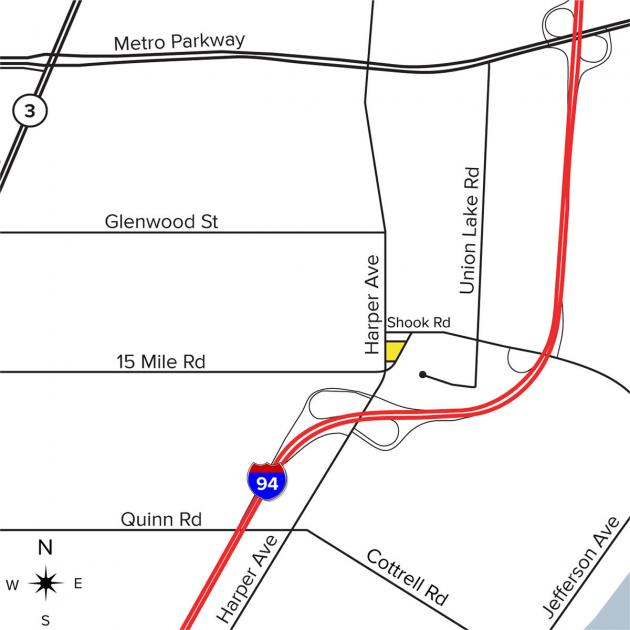
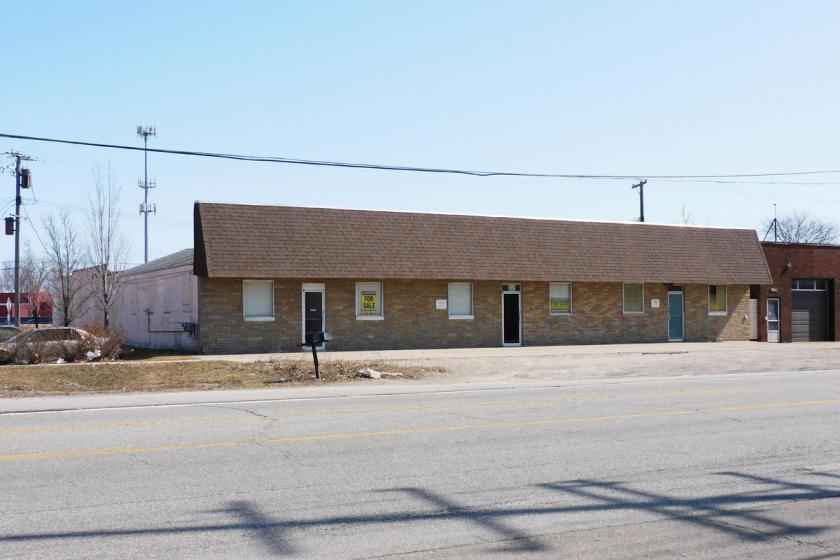
35060 Harper Avenue Clinton Township, MI 48035
35060 Harper Avenue Clinton Township, MI 48035
Details & Description
Listing Agents

Paul Saad
O: 248-359-0652
M: 248-361-0174
psaad@signatureassociates.com
O: 248-359-0652
M: 248-361-0174
psaad@signatureassociates.com
While we strive to provide the most accurate information, all listing information, and demographic data, is provided by third-parties. As such, MyEListing will not be responsible for the accuracy of the information. It is strongly recommended that you verify all information with the listing agent, and any relevant agencies, prior to making any decisions.