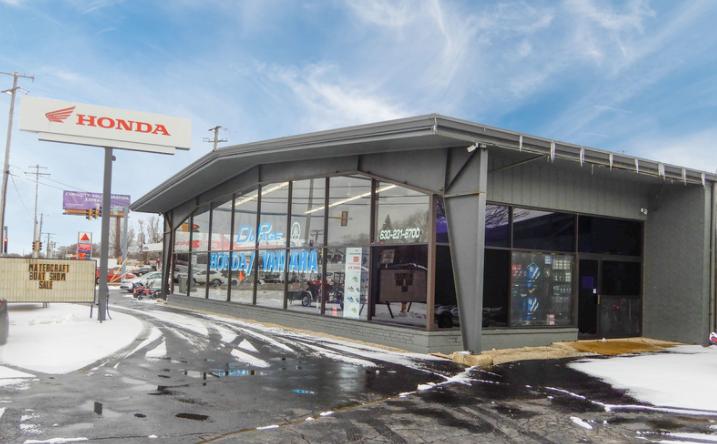
1-Mile | 3-Miles | 5-Miles | ||
---|---|---|---|---|
Total Population | 8,297 | 80,249 | 229,132 | |
Population Median Age | 41 | 39 | 38 | |
Population by Age | 0-9 Yrs | 897 (10%) | 9304 (11%) | 28905 (12%) |
10-19 Yrs | 1133 (13%) | 10297 (12%) | 31055 (13%) | |
20-29 Yrs | 805 (9%) | 10104 (12%) | 29905 (13%) | |
30-39 Yrs | 1129 (13%) | 10403 (12%) | 31038 (13%) | |
40-49 Yrs | 936 (11%) | 10138 (12%) | 27405 (11%) | |
50-59 Yrs | 1423 (17%) | 13116 (16%) | 34732 (15%) | |
60-69 Yrs | 1101 (13%) | 10133 (12%) | 26967 (11%) | |
70+ Yrs | 873 (10%) | 6754 (8%) | 19124 (8%) | |
Median HH Income | $99,521 | $95,221 | $92,402 | |
Total Household Income | < 24K | 219 (7%) | 2368 (8%) | 7536 (9%) |
25-49K | 418 (14%) | 4241 (15%) | 12223 (15%) | |
50-74K | 397 (13%) | 4162 (14%) | 12054 (15%) | |
75-99K | 400 (14%) | 3870 (13%) | 10435 (13%) | |
100-199K | 1115 (39%) | 9884 (35%) | 26285 (33%) | |
200K+ | 303 (10%) | 3279 (11%) | 9621 (12%) | |
Highest Education Level | No Diploma | 646 | 4982 | 15829 |
Diploma or GED | 1136 | 10897 | 30125 | |
Some College | 1262 | 10956 | 30000 | |
Assoc. Degree | 466 | 4563 | 11743 | |
Bachelors Degree | 1568 | 15860 | 42360 | |
Higher Degree | 775 | 8369 | 23823 | |
Total Housing Units | 2,907 | 28,586 | 81,483 | |
--Owner-Occupied | 2,439 | 21,400 | 59,584 | |
--Renter-Occupied | 412 | 6,404 | 18,570 | |
Owner-Occupied Values | < 100K | 84 | 830 | 2240 |
100-199K | 483 | 4495 | 13019 | |
200-299K | 947 | 7789 | 19593 | |
300-399K | 582 | 4765 | 12551 | |
400-499K | 186 | 1949 | 5444 | |
500K+ | 158 | 1573 | 6737 | |
Total Working Age Population | 6,716 | 64,747 | 182,147 | |
In Work Force | 4,615 | 46,095 | 128,489 | |
Not In Work Force | 2,101 | 18,652 | 53,658 | |
Workforce Employed | 4,382 | 44,159 | 123,041 | |
Workforce Unemployed | 231 | 1,883 | 5,358 | |
Civlian Workforce | 4,612 | 46,042 | 128,399 | |
Military Workforce | 3 | 53 | 90 | |
Total Households | 2,851 | 27,804 | 78,154 | |
Family Households | 2,255 | 20,902 | 58,000 | |
Non-Family Households | 596 | 6,902 | 20,154 | |
Married Couple | 1,898 | 16,901 | 46,976 | |
Other Family | 357 | 4,001 | 11,024 | |
Married w/Child | 750 | 6,646 | 20,190 | |
Single Male w/Child | 31 | 379 | 934 | |
Single Female w/Child | 92 | 1,388 | 4,113 |
Population Change Last Two Decades - Plus Projection
2000 | % | 2010 | % | 2020 | % | 2030 | |
---|---|---|---|---|---|---|---|
Illinois | 12,419,293 | +3 | 12,830,632 | +12 | 14,316,487 | +6 | 15,138,849 |
Cook County | 5,376,741 | -3 | 5,194,675 | +10 | 5,707,832 | +5 | 5,990,243 |
DuPage County | 904,161 | +1 | 916,924 | +10 | 1,010,323 | +2 | 1,034,039 |
Kane County | 404,119 | +28 | 515,269 | +22 | 630,563 | +8 | 679,403 |
Total Working Age Population:
Total Households:
Total Working Age Population:
Total Households:
Total Working Age Population:
Total Households: