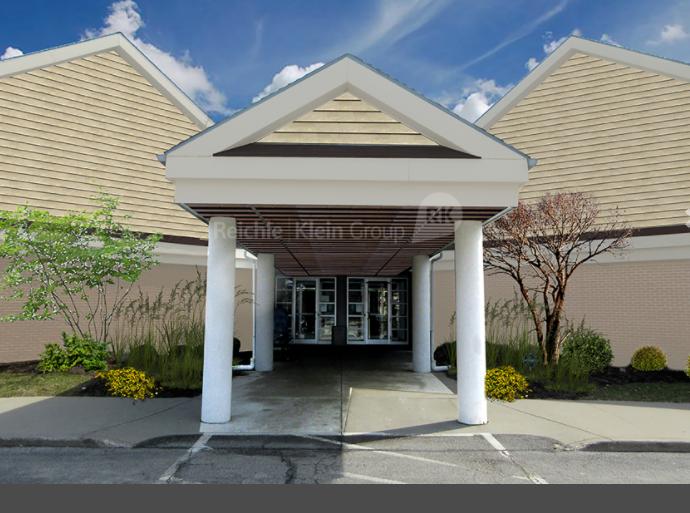
Medical-office building available for lease
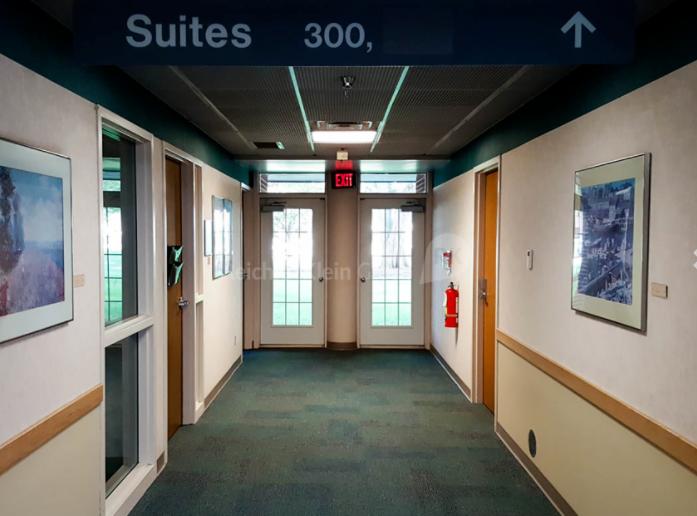
Professionally maintained since construction
Currently configured into six separate suites
TI allowance
48 exam rooms with plumbing
20 physicians offices, multiple conference, ultrasound, lab and radiology rooms
Waiting rooms, in-suite restrooms, ADA
Fully sprinkled
Access from both W. Sylvania Avenue and Harvest Lane
6.5-per-1,000 parking ratio (186 stalls)
Prominent monument signage on W. Sylvania Avenue and Harvest Lane
Professionally landscaped
No part of this information may be copied, reproduced, repurposed, or screen-captured for any commercial purpose without prior written authorization from MyEListing.
While we strive to provide the most accurate information, all listing information, and demographic data, is provided by third-parties. As such, MyEListing will not be responsible for the accuracy of the information. It is strongly recommended that you verify all information with the listing agent, and any relevant agencies, prior to making any decisions.
What is the asking price for 3740 West Sylvania Avenue in Toledo?
The asking price for 3740 West Sylvania Avenue is $11.00 a SF per Year
What is the building size of this commercial Office property?
The size of this multi-unit property varies between 465 - 10850 square feet
What kind of Office is the propery at 3740 West Sylvania Avenue?
The property at 3740 West Sylvania Avenue Toledo, OH 43623 is listed as a Professional Office property
What is the population within 1 mile of 3740 West Sylvania Avenue in Toledo?
The population within 1 mile of 3740 West Sylvania Avenue Toledo, OH 43623 is 9,567 people.
Who do I contact for questions about 3740 West Sylvania Avenue?
You should contact the listing agent,
Marty Gallagher, for any details regarding this commercial listing.