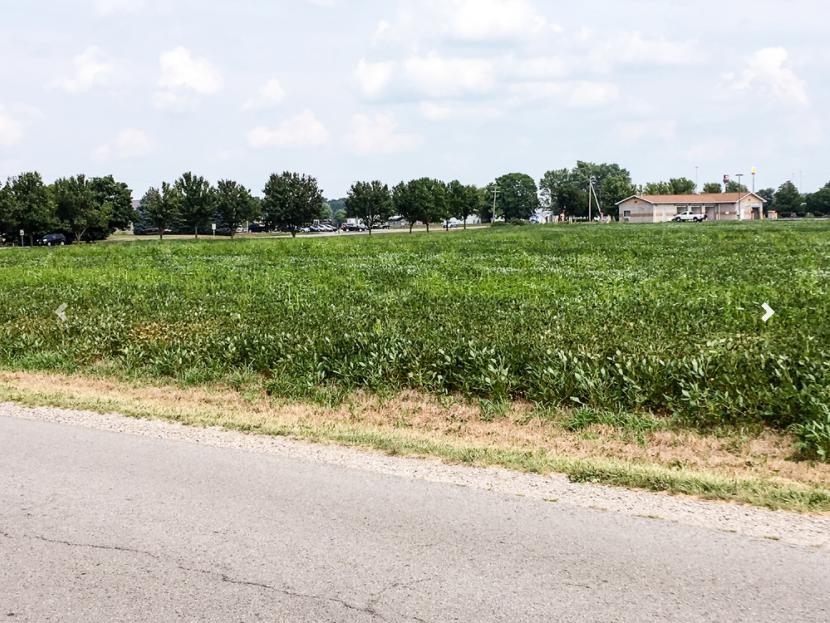
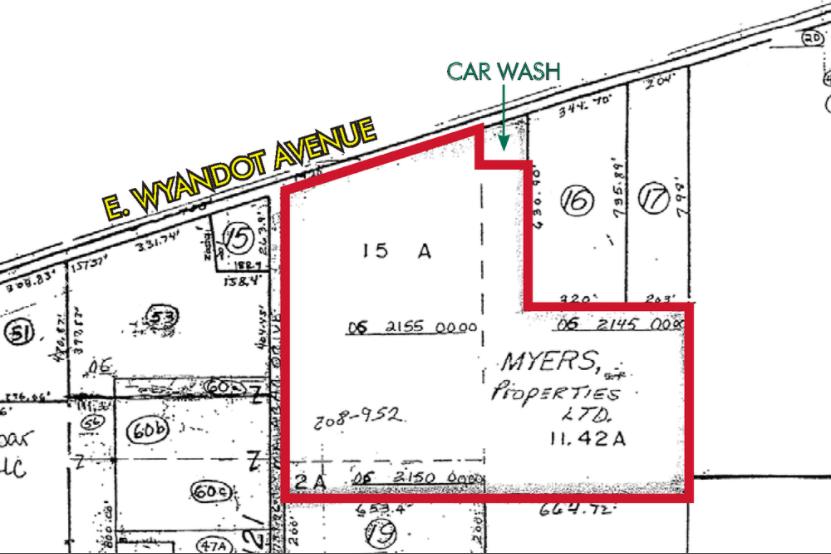
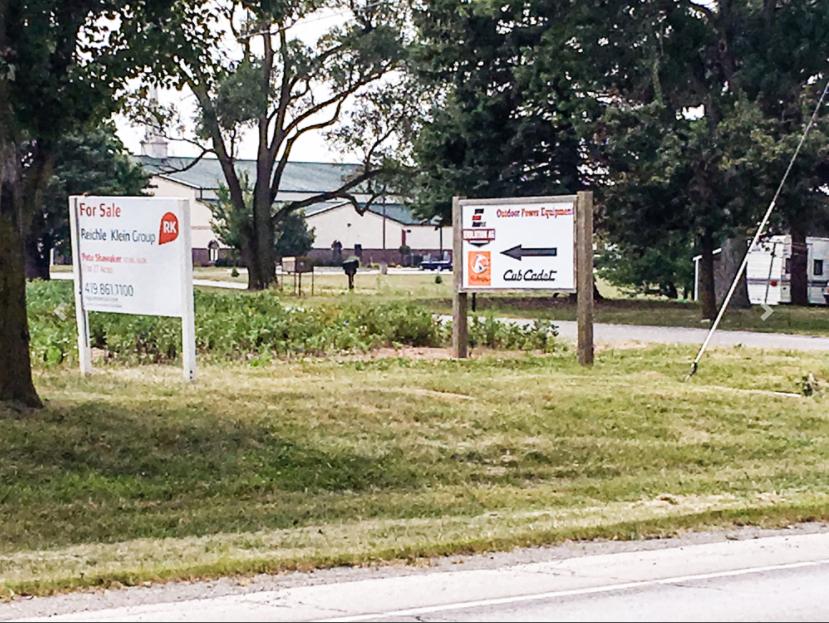
1-Mile | 3-Miles | 5-Miles | ||
---|---|---|---|---|
Total Population | 688 | 6,280 | 8,408 | |
Population Median Age | 48 | 40 | 41 | |
Population by Age | 0-9 Yrs | 65 (9%) | 796 (12%) | 1054 (12%) |
10-19 Yrs | 52 (7%) | 837 (13%) | 1071 (12%) | |
20-29 Yrs | 70 (10%) | 860 (13%) | 1073 (12%) | |
30-39 Yrs | 69 (10%) | 794 (12%) | 1011 (12%) | |
40-49 Yrs | 42 (6%) | 596 (9%) | 850 (10%) | |
50-59 Yrs | 124 (18%) | 795 (12%) | 1109 (13%) | |
60-69 Yrs | 92 (13%) | 741 (11%) | 1036 (12%) | |
70+ Yrs | 174 (25%) | 862 (13%) | 1204 (14%) | |
Median HH Income | $46,903 | $49,621 | $51,116 | |
Total Household Income | < 24K | 84 (24%) | 604 (22%) | 776 (21%) |
25-49K | 94 (27%) | 748 (27%) | 955 (26%) | |
50-74K | 65 (19%) | 591 (22%) | 784 (22%) | |
75-99K | 46 (13%) | 290 (10%) | 405 (11%) | |
100-199K | 45 (13%) | 411 (15%) | 565 (15%) | |
200K+ | 5 (1%) | 40 (1%) | 70 (1%) | |
Highest Education Level | No Diploma | 23 | 318 | 438 |
Diploma or GED | 211 | 1751 | 2432 | |
Some College | 74 | 750 | 979 | |
Assoc. Degree | 75 | 463 | 664 | |
Bachelors Degree | 93 | 650 | 873 | |
Higher Degree | 59 | 256 | 352 | |
Total Housing Units | 350 | 2,913 | 3,866 | |
--Owner-Occupied | 268 | 1,769 | 2,362 | |
--Renter-Occupied | 72 | 915 | 1,193 | |
Owner-Occupied Values | < 100K | 89 | 730 | 881 |
100-199K | 137 | 836 | 1121 | |
200-299K | 31 | 136 | 236 | |
300-399K | 5 | 39 | 73 | |
400-499K | 5 | 25 | 38 | |
500K+ | 0 | 3 | 13 | |
Total Working Age Population | 607 | 5,050 | 6,771 | |
In Work Force | 351 | 3,371 | 4,394 | |
Not In Work Force | 256 | 1,679 | 2,377 | |
Workforce Employed | 350 | 3,316 | 4,318 | |
Workforce Unemployed | 1 | 55 | 77 | |
Civlian Workforce | 351 | 3,371 | 4,394 | |
Military Workforce | 0 | 0 | 0 | |
Total Households | 340 | 2,683 | 3,555 | |
Family Households | 211 | 1,711 | 2,331 | |
Non-Family Households | 129 | 973 | 1,224 | |
Married Couple | 148 | 1,145 | 1,650 | |
Other Family | 63 | 566 | 681 | |
Married w/Child | 41 | 397 | 553 | |
Single Male w/Child | 4 | 126 | 136 | |
Single Female w/Child | 37 | 260 | 326 |
Population Change Last Two Decades - Plus Projection
2000 | % | 2010 | % | 2020 | % | 2030 | |
---|---|---|---|---|---|---|---|
Ohio | 11,353,140 | +2 | 11,536,504 | 0 | 11,574,870 | 0 | 11,615,100 |
Wyandot County | 22,908 | -1 | 22,615 | -3 | 21,960 | -4 | 21,000 |
Total Working Age Population:
Total Households:
Total Working Age Population:
Total Households:
Total Working Age Population:
Total Households: