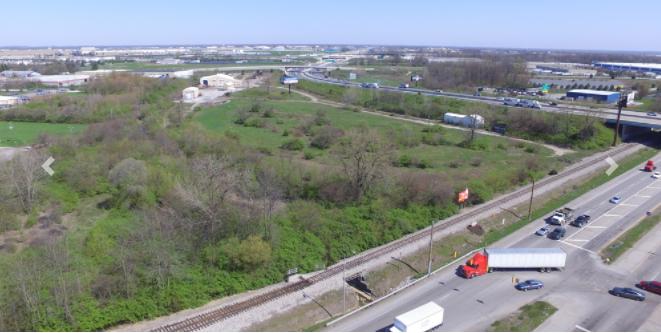
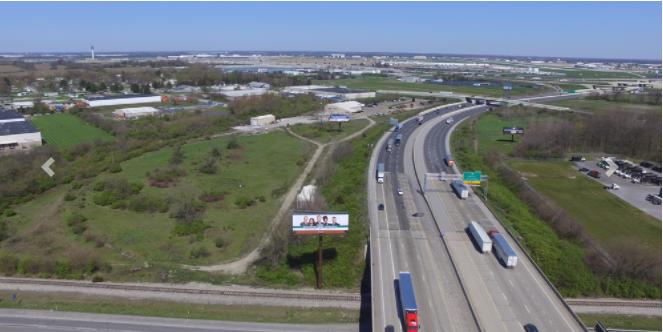
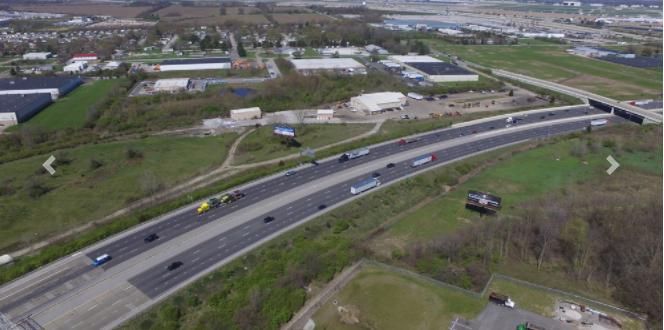
The subject property is 10 Acres located adjacent to I-465 at Kentucky Avenue on the SW side of Indianapolis. This property provides the heaviest zoning available in Marion County. The site has rail access from the south, with a dedicated spur in place along Indiana Southern Railroad's tracks. The property provides 10 acres of land for development of warehouse, manufacturing, truck maintenance, headquarters operations, and much more.
Highlights
10 Acres at $1,950/Acre/Month
Will Entertain Build-To-Suit
I-4-S Heavy Industrial Zoning
Across street from Indianapolis International Airport
Easy access to I-465
Potential for dense coverage in new development
No part of this information may be copied, reproduced, repurposed, or screen-captured for any commercial purpose without prior written authorization from MyEListing.
While we strive to provide the most accurate information, all listing information, and demographic data, is provided by third-parties. As such, MyEListing will not be responsible for the accuracy of the information. It is strongly recommended that you verify all information with the listing agent, and any relevant agencies, prior to making any decisions.
What is the asking price for 6111 West Hanna Avenue in Indianapolis?
The asking price for 6111 West Hanna Avenue is $0.54 a SF per Year
What kind of Land is the propery at 6111 West Hanna Avenue?
The property at 6111 West Hanna Avenue Indianapolis, IN 46241 is listed as a Mixed Use Land Land property
What is the population within 1 mile of 6111 West Hanna Avenue in Indianapolis?
The population within 1 mile of 6111 West Hanna Avenue Indianapolis, IN 46241 is 3,492 people.
Who do I contact for questions about 6111 West Hanna Avenue?
You should contact the listing agent,
Rob Coombes, for any details regarding this commercial listing.