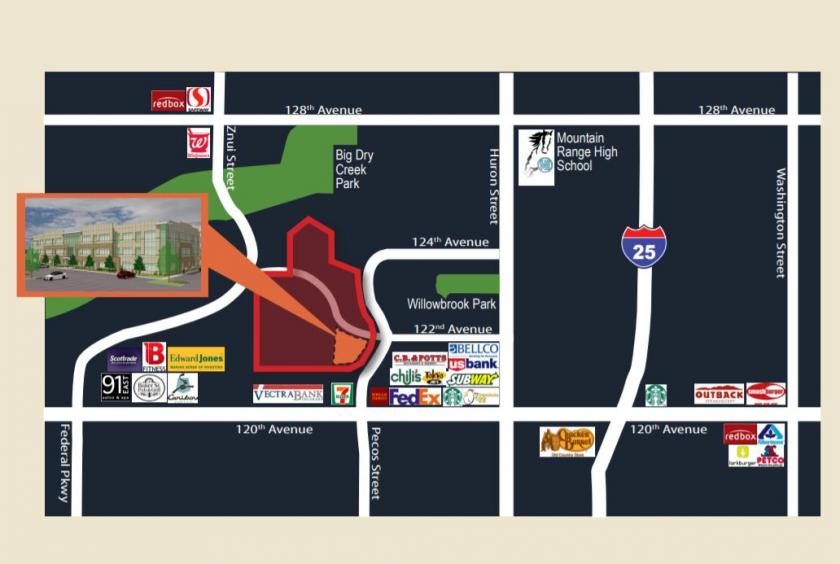
1-Mile | 3-Miles | 5-Miles | ||
---|---|---|---|---|
Total Population | 10,453 | 119,562 | 303,377 | |
Population Median Age | 36 | 36 | 36 | |
Population by Age | 0-9 Yrs | 1277 (12%) | 16784 (14%) | 42637 (14%) |
10-19 Yrs | 1067 (10%) | 15634 (13%) | 42684 (14%) | |
20-29 Yrs | 2080 (19%) | 16272 (13%) | 42057 (13%) | |
30-39 Yrs | 1858 (17%) | 18956 (15%) | 47969 (15%) | |
40-49 Yrs | 1468 (14%) | 16071 (13%) | 41042 (13%) | |
50-59 Yrs | 1145 (10%) | 15450 (12%) | 38442 (12%) | |
60-69 Yrs | 1042 (9%) | 11408 (9%) | 26976 (8%) | |
70+ Yrs | 515 (4%) | 8986 (7%) | 21569 (7%) | |
Median HH Income | $66,928 | $81,642 | $79,829 | |
Total Household Income | < 24K | 433 (10%) | 4299 (9%) | 11083 (10%) |
25-49K | 1095 (25%) | 8135 (18%) | 19396 (17%) | |
50-74K | 904 (21%) | 7807 (17%) | 20203 (18%) | |
75-99K | 589 (13%) | 6450 (14%) | 16581 (15%) | |
100-199K | 870 (20%) | 13252 (30%) | 31538 (29%) | |
200K+ | 367 (8%) | 3967 (9%) | 8971 (8%) | |
Highest Education Level | No Diploma | 531 | 6267 | 21076 |
Diploma or GED | 1500 | 18213 | 47705 | |
Some College | 1799 | 18042 | 43600 | |
Assoc. Degree | 731 | 7622 | 18456 | |
Bachelors Degree | 1716 | 18952 | 45306 | |
Higher Degree | 1070 | 10978 | 23625 | |
Total Housing Units | 4,599 | 45,573 | 111,518 | |
--Owner-Occupied | 1,915 | 28,782 | 73,297 | |
--Renter-Occupied | 2,342 | 15,129 | 34,475 | |
Owner-Occupied Values | < 100K | 97 | 1283 | 5274 |
100-199K | 271 | 1971 | 5058 | |
200-299K | 395 | 6231 | 18042 | |
300-399K | 434 | 9417 | 23298 | |
400-499K | 300 | 4695 | 10985 | |
500K+ | 419 | 5185 | 10640 | |
Total Working Age Population | 8,542 | 92,903 | 233,654 | |
In Work Force | 6,415 | 67,691 | 171,172 | |
Not In Work Force | 2,126 | 25,212 | 62,482 | |
Workforce Employed | 6,164 | 65,254 | 164,841 | |
Workforce Unemployed | 251 | 2,366 | 6,143 | |
Civlian Workforce | 6,415 | 67,620 | 170,983 | |
Military Workforce | 0 | 71 | 188 | |
Total Households | 4,257 | 43,911 | 107,772 | |
Family Households | 2,574 | 29,997 | 74,468 | |
Non-Family Households | 1,683 | 13,914 | 33,304 | |
Married Couple | 1,784 | 23,147 | 56,791 | |
Other Family | 791 | 6,850 | 17,677 | |
Married w/Child | 627 | 10,370 | 26,069 | |
Single Male w/Child | 111 | 1,096 | 3,064 | |
Single Female w/Child | 323 | 2,590 | 6,739 |
Population Change Last Two Decades - Plus Projection
2000 | % | 2010 | % | 2020 | % | 2030 | |
---|---|---|---|---|---|---|---|
Colorado | 4,301,261 | +17 | 5,029,196 | +16 | 5,838,181 | +15 | 6,733,658 |
Adams County | 363,857 | +21 | 441,603 | +20 | 530,680 | +21 | 642,318 |
Boulder County | 291,288 | +1 | 294,567 | +13 | 332,134 | +12 | 370,618 |
Broomfield County | 0 | 55,889 | +32 | 73,822 | +28 | 94,282 | |
Denver County | 554,636 | +8 | 600,158 | +23 | 738,611 | +12 | 827,681 |
Jefferson County | 527,056 | +1 | 534,543 | +10 | 587,118 | +7 | 626,742 |
Total Working Age Population:
Total Households:
Total Working Age Population:
Total Households:
Total Working Age Population:
Total Households: