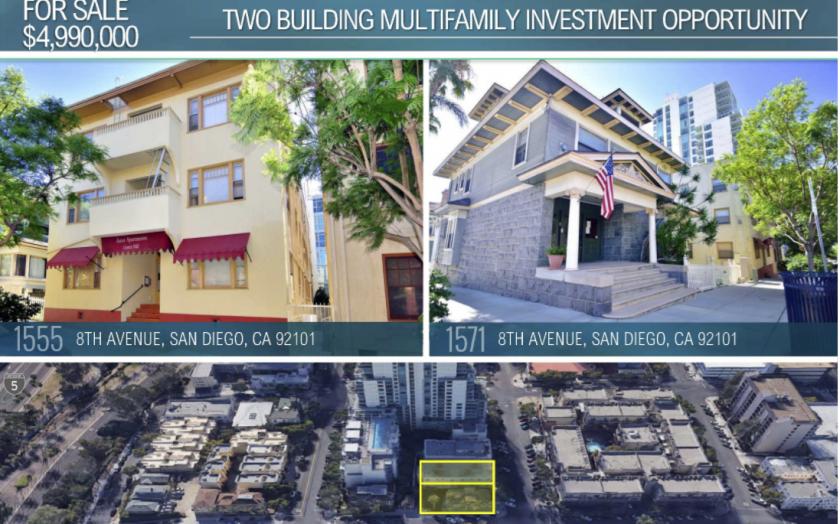
1-Mile | 3-Miles | 5-Miles | ||
---|---|---|---|---|
Total Population | 35,855 | 207,084 | 517,622 | |
Population Median Age | 42 | 38 | 36 | |
Population by Age | 0-9 Yrs | 1371 (3%) | 17925 (8%) | 56097 (10%) |
10-19 Yrs | 822 (2%) | 17075 (8%) | 57530 (11%) | |
20-29 Yrs | 8230 (22%) | 42672 (20%) | 107026 (20%) | |
30-39 Yrs | 9179 (25%) | 42272 (20%) | 92880 (17%) | |
40-49 Yrs | 4551 (12%) | 27188 (13%) | 65019 (12%) | |
50-59 Yrs | 4135 (11%) | 23222 (11%) | 55803 (10%) | |
60-69 Yrs | 3745 (10%) | 19674 (9%) | 44271 (8%) | |
70+ Yrs | 3822 (10%) | 17055 (8%) | 38996 (7%) | |
Median HH Income | $70,651 | $69,319 | $63,549 | |
Total Household Income | < 24K | 4784 (22%) | 17112 (18%) | 38079 (19%) |
25-49K | 3166 (15%) | 17057 (18%) | 40055 (20%) | |
50-74K | 2927 (14%) | 15198 (16%) | 33136 (17%) | |
75-99K | 2549 (12%) | 11942 (12%) | 24102 (12%) | |
100-199K | 5178 (24%) | 21942 (23%) | 42978 (22%) | |
200K+ | 2225 (10%) | 8918 (9%) | 15718 (8%) | |
Highest Education Level | No Diploma | 2315 | 18694 | 60167 |
Diploma or GED | 4070 | 22004 | 61073 | |
Some College | 6209 | 30373 | 73255 | |
Assoc. Degree | 2310 | 11292 | 24814 | |
Bachelors Degree | 9802 | 43508 | 83375 | |
Higher Degree | 6863 | 31040 | 54219 | |
Total Housing Units | 24,105 | 103,506 | 215,538 | |
--Owner-Occupied | 4,805 | 27,496 | 62,732 | |
--Renter-Occupied | 16,024 | 64,673 | 131,336 | |
Owner-Occupied Values | < 100K | 105 | 425 | 1647 |
100-199K | 12 | 667 | 1820 | |
200-299K | 87 | 1468 | 4268 | |
300-399K | 695 | 3453 | 10069 | |
400-499K | 709 | 3573 | 10143 | |
500K+ | 3198 | 17909 | 34785 | |
Total Working Age Population | 34,191 | 179,855 | 429,846 | |
In Work Force | 23,032 | 129,047 | 300,911 | |
Not In Work Force | 11,159 | 50,809 | 128,935 | |
Workforce Employed | 20,469 | 112,924 | 254,805 | |
Workforce Unemployed | 1,088 | 6,121 | 16,898 | |
Civlian Workforce | 21,557 | 119,045 | 271,703 | |
Military Workforce | 1,475 | 10,001 | 29,208 | |
Total Households | 20,829 | 92,169 | 194,069 | |
Family Households | 5,621 | 38,337 | 100,129 | |
Non-Family Households | 15,208 | 53,833 | 93,940 | |
Married Couple | 4,396 | 27,871 | 68,799 | |
Other Family | 1,225 | 10,465 | 31,329 | |
Married w/Child | 585 | 9,495 | 27,962 | |
Single Male w/Child | 253 | 1,329 | 3,778 | |
Single Female w/Child | 355 | 3,799 | 11,674 |
Population Change Last Two Decades - Plus Projection
2000 | % | 2010 | % | 2020 | % | 2030 | |
---|---|---|---|---|---|---|---|
California | 33,871,648 | +10 | 37,253,956 | +9 | 40,467,295 | +8 | 43,631,295 |
San Diego County | 2,813,833 | +10 | 3,095,313 | +10 | 3,390,529 | +6 | 3,608,286 |
Total Working Age Population:
Total Households:
Total Working Age Population:
Total Households:
Total Working Age Population:
Total Households: