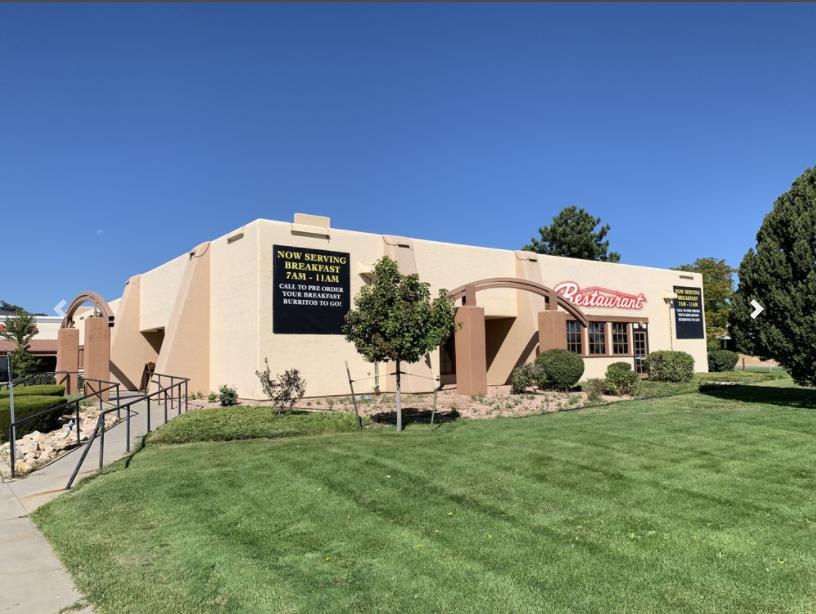
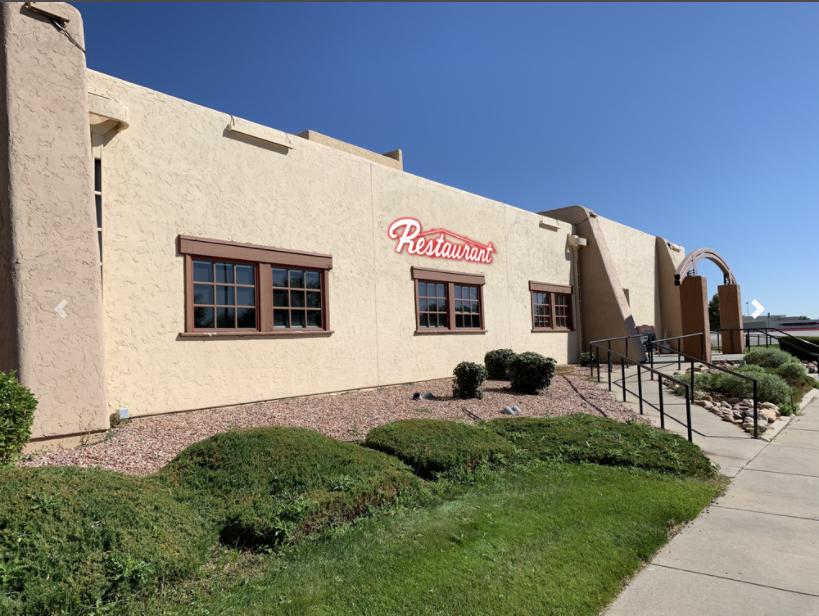
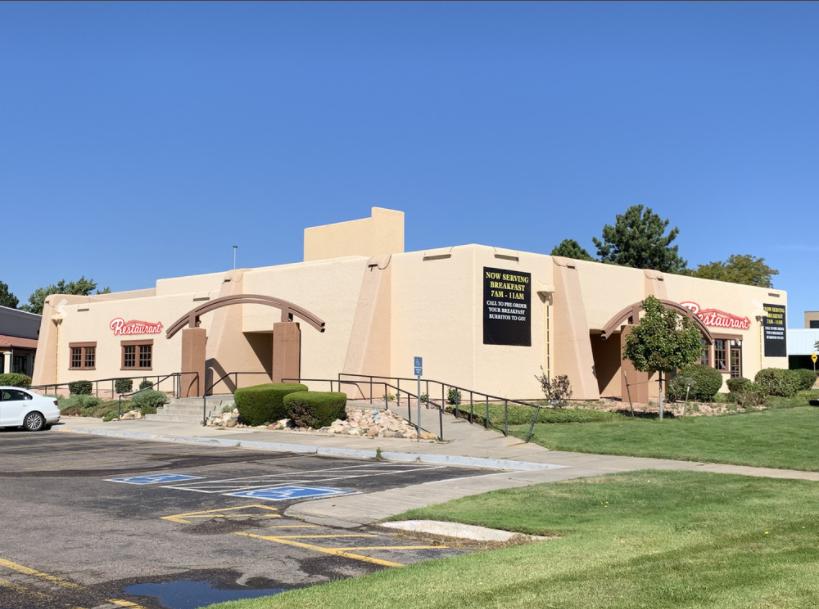
1-Mile | 3-Miles | 5-Miles | ||
---|---|---|---|---|
Total Population | 15,911 | 109,065 | 298,203 | |
Population Median Age | 39 | 39 | 38 | |
Population by Age | 0-9 Yrs | 1604 (10%) | 13043 (11%) | 36589 (12%) |
10-19 Yrs | 1749 (10%) | 12368 (11%) | 36072 (12%) | |
20-29 Yrs | 2474 (15%) | 14461 (13%) | 42574 (14%) | |
30-39 Yrs | 2866 (18%) | 16803 (15%) | 47006 (15%) | |
40-49 Yrs | 2036 (12%) | 13424 (12%) | 37002 (12%) | |
50-59 Yrs | 1781 (11%) | 14646 (13%) | 39487 (13%) | |
60-69 Yrs | 1541 (9%) | 12817 (11%) | 31842 (10%) | |
70+ Yrs | 1861 (11%) | 11503 (10%) | 27631 (9%) | |
Median HH Income | $68,044 | $78,759 | $72,712 | |
Total Household Income | < 24K | 831 (11%) | 4355 (10%) | 14500 (12%) |
25-49K | 1447 (20%) | 7345 (17%) | 22480 (19%) | |
50-74K | 1745 (24%) | 8603 (20%) | 22568 (19%) | |
75-99K | 923 (12%) | 6378 (14%) | 16847 (14%) | |
100-199K | 1856 (26%) | 12923 (30%) | 31143 (27%) | |
200K+ | 307 (4%) | 2920 (6%) | 7571 (6%) | |
Highest Education Level | No Diploma | 572 | 5726 | 22684 |
Diploma or GED | 2391 | 18174 | 51030 | |
Some College | 3027 | 18303 | 45987 | |
Assoc. Degree | 1142 | 6745 | 17256 | |
Bachelors Degree | 2924 | 18726 | 46618 | |
Higher Degree | 1306 | 9592 | 23878 | |
Total Housing Units | 7,273 | 43,693 | 119,110 | |
--Owner-Occupied | 4,538 | 30,819 | 76,023 | |
--Renter-Occupied | 2,571 | 11,705 | 39,086 | |
Owner-Occupied Values | < 100K | 148 | 607 | 5090 |
100-199K | 710 | 2411 | 5609 | |
200-299K | 1605 | 8295 | 18430 | |
300-399K | 1066 | 10221 | 24407 | |
400-499K | 716 | 5915 | 13526 | |
500K+ | 293 | 3370 | 8960 | |
Total Working Age Population | 13,510 | 88,616 | 240,099 | |
In Work Force | 9,869 | 62,661 | 170,426 | |
Not In Work Force | 3,640 | 25,955 | 69,674 | |
Workforce Employed | 9,485 | 60,198 | 163,617 | |
Workforce Unemployed | 384 | 2,408 | 6,668 | |
Civlian Workforce | 9,869 | 62,606 | 170,285 | |
Military Workforce | 0 | 55 | 140 | |
Total Households | 7,109 | 42,524 | 115,108 | |
Family Households | 3,729 | 27,651 | 73,405 | |
Non-Family Households | 3,380 | 14,873 | 41,704 | |
Married Couple | 2,560 | 21,300 | 54,414 | |
Other Family | 1,169 | 6,351 | 18,990 | |
Married w/Child | 929 | 7,928 | 21,670 | |
Single Male w/Child | 111 | 1,095 | 3,053 | |
Single Female w/Child | 398 | 1,968 | 6,398 |
Population Change Last Two Decades - Plus Projection
2000 | % | 2010 | % | 2020 | % | 2030 | |
---|---|---|---|---|---|---|---|
Colorado | 4,301,261 | +17 | 5,029,196 | +16 | 5,838,181 | +15 | 6,733,658 |
Adams County | 363,857 | +21 | 441,603 | +20 | 530,680 | +21 | 642,318 |
Boulder County | 291,288 | +1 | 294,567 | +13 | 332,134 | +12 | 370,618 |
Broomfield County | 0 | 55,889 | +32 | 73,822 | +28 | 94,282 | |
Denver County | 554,636 | +8 | 600,158 | +23 | 738,611 | +12 | 827,681 |
Jefferson County | 527,056 | +1 | 534,543 | +10 | 587,118 | +7 | 626,742 |
Total Working Age Population:
Total Households:
Total Working Age Population:
Total Households:
Total Working Age Population:
Total Households: