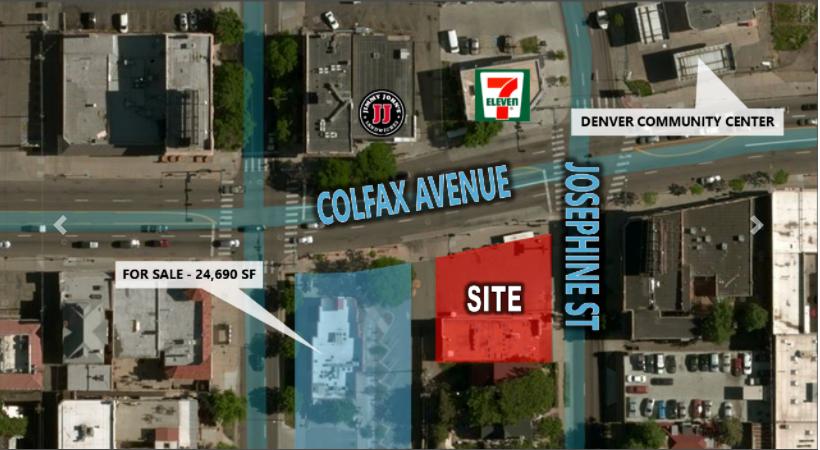
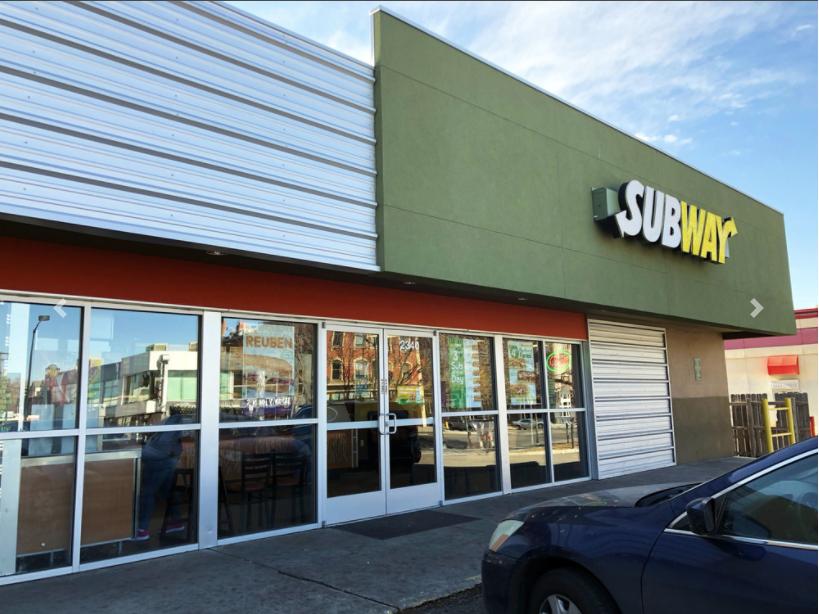
1-Mile | 3-Miles | 5-Miles | ||
---|---|---|---|---|
Total Population | 34,875 | 212,739 | 481,797 | |
Population Median Age | 38 | 38 | 37 | |
Population by Age | 0-9 Yrs | 1929 (5%) | 17238 (8%) | 50914 (10%) |
10-19 Yrs | 1383 (3%) | 13377 (6%) | 43703 (9%) | |
20-29 Yrs | 9161 (26%) | 46228 (21%) | 92780 (19%) | |
30-39 Yrs | 9414 (26%) | 50834 (23%) | 102323 (21%) | |
40-49 Yrs | 4100 (11%) | 26963 (12%) | 63435 (13%) | |
50-59 Yrs | 3298 (9%) | 22302 (10%) | 49471 (10%) | |
60-69 Yrs | 3198 (9%) | 20081 (9%) | 43359 (8%) | |
70+ Yrs | 2392 (6%) | 15715 (7%) | 35811 (7%) | |
Median HH Income | $63,964 | $74,563 | $68,098 | |
Total Household Income | < 24K | 3529 (18%) | 18820 (17%) | 40896 (18%) |
25-49K | 3979 (20%) | 18263 (16%) | 41283 (18%) | |
50-74K | 3462 (17%) | 17966 (16%) | 36147 (16%) | |
75-99K | 2195 (11%) | 12636 (11%) | 25645 (11%) | |
100-199K | 4055 (20%) | 27128 (24%) | 50251 (22%) | |
200K+ | 2205 (11%) | 14722 (13%) | 24778 (11%) | |
Highest Education Level | No Diploma | 892 | 10462 | 38138 |
Diploma or GED | 2577 | 17050 | 53037 | |
Some College | 3887 | 24297 | 54246 | |
Assoc. Degree | 1503 | 7586 | 17424 | |
Bachelors Degree | 12492 | 65076 | 116871 | |
Higher Degree | 8399 | 44769 | 77296 | |
Total Housing Units | 20,815 | 119,208 | 235,925 | |
--Owner-Occupied | 6,556 | 46,011 | 99,710 | |
--Renter-Occupied | 12,869 | 63,525 | 119,290 | |
Owner-Occupied Values | < 100K | 130 | 834 | 2491 |
100-199K | 570 | 2617 | 9616 | |
200-299K | 891 | 5357 | 15326 | |
300-399K | 949 | 6754 | 16520 | |
400-499K | 812 | 7731 | 15430 | |
500K+ | 3204 | 22718 | 40326 | |
Total Working Age Population | 32,068 | 187,808 | 405,139 | |
In Work Force | 25,735 | 143,955 | 297,547 | |
Not In Work Force | 6,333 | 43,853 | 107,592 | |
Workforce Employed | 24,934 | 138,512 | 285,234 | |
Workforce Unemployed | 797 | 5,372 | 12,115 | |
Civlian Workforce | 25,730 | 143,884 | 297,350 | |
Military Workforce | 5 | 71 | 198 | |
Total Households | 19,425 | 109,535 | 219,000 | |
Family Households | 5,484 | 38,968 | 95,292 | |
Non-Family Households | 13,941 | 70,568 | 123,708 | |
Married Couple | 4,388 | 29,460 | 67,303 | |
Other Family | 1,097 | 9,508 | 27,989 | |
Married w/Child | 1,327 | 10,137 | 27,519 | |
Single Male w/Child | 180 | 1,599 | 3,986 | |
Single Female w/Child | 406 | 2,979 | 10,124 |
Population Change Last Two Decades - Plus Projection
2000 | % | 2010 | % | 2020 | % | 2030 | |
---|---|---|---|---|---|---|---|
Colorado | 4,301,261 | +17 | 5,029,196 | +16 | 5,838,181 | +15 | 6,733,658 |
Adams County | 363,857 | +21 | 441,603 | +20 | 530,680 | +21 | 642,318 |
Arapahoe County | 487,967 | +17 | 572,003 | +16 | 662,304 | +13 | 750,773 |
Denver County | 554,636 | +8 | 600,158 | +23 | 738,611 | +12 | 827,681 |
Jefferson County | 527,056 | +1 | 534,543 | +10 | 587,118 | +7 | 626,742 |
Total Working Age Population:
Total Households:
Total Working Age Population:
Total Households:
Total Working Age Population:
Total Households: