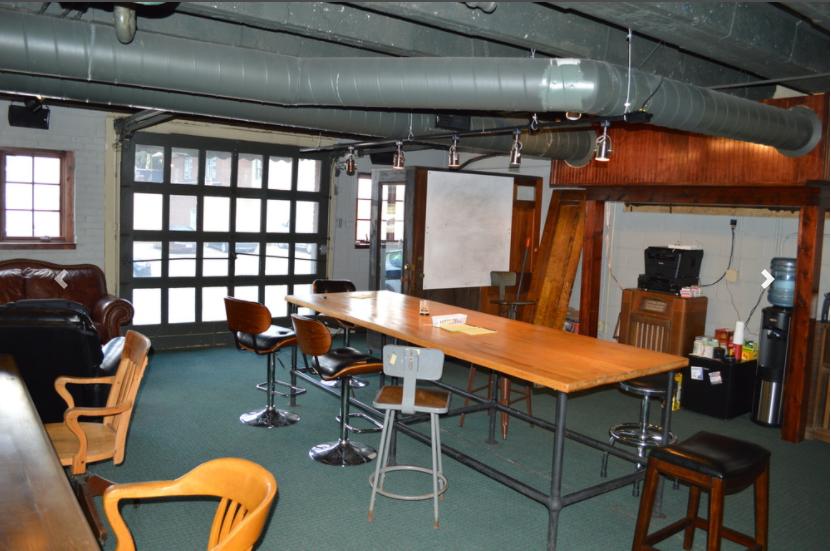
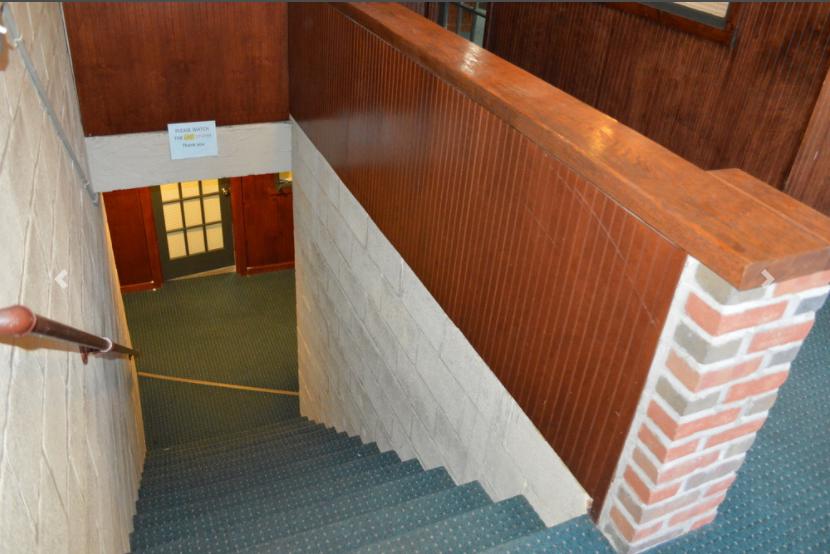
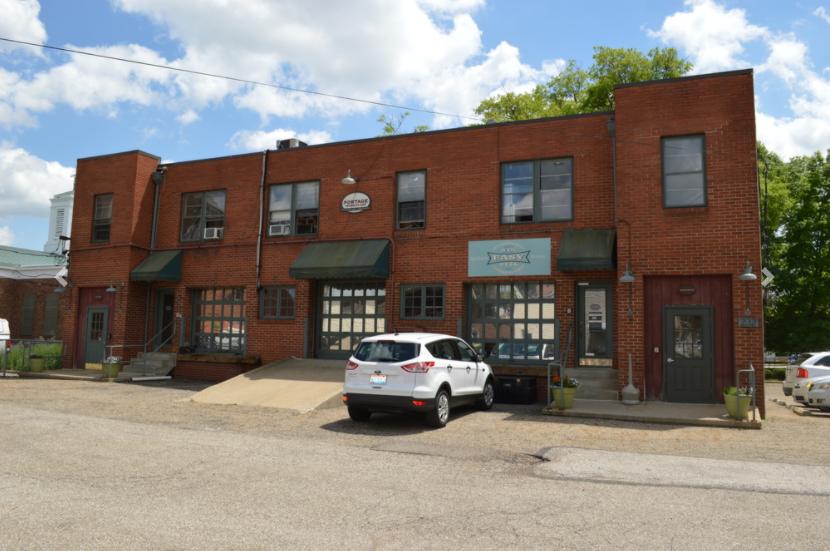
1-Mile | 3-Miles | 5-Miles | ||
---|---|---|---|---|
Total Population | 17,032 | 86,131 | 191,532 | |
Population Median Age | 39 | 40 | 40 | |
Population by Age | 0-9 Yrs | 1775 (10%) | 9026 (10%) | 20898 (10%) |
10-19 Yrs | 1916 (11%) | 9842 (11%) | 22583 (11%) | |
20-29 Yrs | 2534 (14%) | 12742 (14%) | 31189 (16%) | |
30-39 Yrs | 2799 (16%) | 12093 (14%) | 25139 (13%) | |
40-49 Yrs | 2157 (12%) | 10665 (12%) | 22188 (11%) | |
50-59 Yrs | 2288 (13%) | 10821 (12%) | 24496 (12%) | |
60-69 Yrs | 1952 (11%) | 10846 (12%) | 23247 (12%) | |
70+ Yrs | 1612 (9%) | 10096 (11%) | 21794 (11%) | |
Median HH Income | $53,349 | $52,922 | $51,746 | |
Total Household Income | < 24K | 1633 (20%) | 7927 (21%) | 18875 (23%) |
25-49K | 2035 (26%) | 9739 (26%) | 20717 (25%) | |
50-74K | 1639 (21%) | 7491 (20%) | 15384 (18%) | |
75-99K | 1164 (14%) | 4911 (13%) | 10406 (12%) | |
100-199K | 1273 (16%) | 6127 (16%) | 13530 (16%) | |
200K+ | 45 (0%) | 1046 (2%) | 2667 (3%) | |
Highest Education Level | No Diploma | 722 | 6301 | 12020 |
Diploma or GED | 3878 | 19108 | 38720 | |
Some College | 2554 | 12576 | 27773 | |
Assoc. Degree | 1205 | 5226 | 11267 | |
Bachelors Degree | 2850 | 12770 | 28584 | |
Higher Degree | 1279 | 6141 | 15014 | |
Total Housing Units | 8,310 | 40,379 | 89,939 | |
--Owner-Occupied | 4,651 | 21,431 | 45,935 | |
--Renter-Occupied | 3,138 | 15,811 | 35,643 | |
Owner-Occupied Values | < 100K | 1407 | 6902 | 14856 |
100-199K | 3189 | 11177 | 21492 | |
200-299K | 46 | 2280 | 6539 | |
300-399K | 0 | 601 | 1820 | |
400-499K | 0 | 203 | 642 | |
500K+ | 9 | 267 | 585 | |
Total Working Age Population | 14,074 | 71,493 | 158,414 | |
In Work Force | 10,048 | 46,355 | 102,123 | |
Not In Work Force | 4,026 | 25,138 | 56,291 | |
Workforce Employed | 9,723 | 44,183 | 96,897 | |
Workforce Unemployed | 325 | 2,105 | 5,120 | |
Civlian Workforce | 10,048 | 46,288 | 102,016 | |
Military Workforce | 0 | 67 | 107 | |
Total Households | 7,789 | 37,242 | 81,578 | |
Family Households | 4,116 | 20,761 | 45,292 | |
Non-Family Households | 3,673 | 16,481 | 36,286 | |
Married Couple | 3,192 | 15,449 | 31,438 | |
Other Family | 924 | 5,312 | 13,854 | |
Married w/Child | 1,343 | 5,775 | 11,103 | |
Single Male w/Child | 156 | 632 | 1,581 | |
Single Female w/Child | 239 | 1,812 | 5,733 |
Population Change Last Two Decades - Plus Projection
2000 | % | 2010 | % | 2020 | % | 2030 | |
---|---|---|---|---|---|---|---|
Ohio | 11,353,140 | +2 | 11,536,504 | 0 | 11,574,870 | 0 | 11,615,100 |
Portage County | 152,061 | +6 | 161,419 | 0 | 161,410 | -2 | 158,930 |
Summit County | 542,899 | 0 | 541,781 | -1 | 534,150 | -1 | 528,990 |
Total Working Age Population:
Total Households:
Total Working Age Population:
Total Households:
Total Working Age Population:
Total Households: