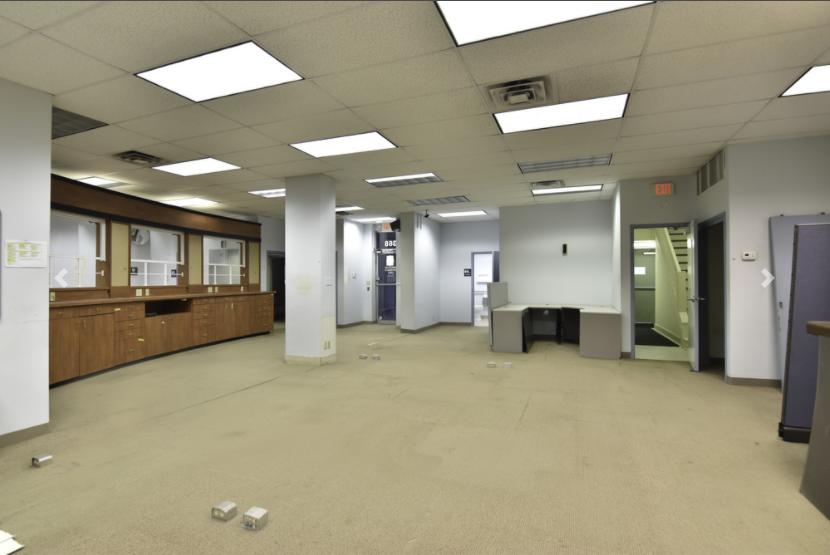
Mixed-Use Redevelopment or Owner-User. Located in the Historic Main-Exchange District, Downtown Akron and directly across
from 22 Exchange (236 new market rate apartments) and 401 Lofts (189 units/323 student housing beds). This 2-story gem is a
great mixed-use redevelopment project consisting of ground level retail and 2nd floor apartments (taking advantage of the city's 15-yr tax abatement), project ROI over 11% (at listing price); Minimum $102,000 stabilized NOI.
REQUEST FULL OM FOR PROJECTED REDEVELOPMENT COSTS & ANALYSIS
Highlights
Drive-Thru - A Unique Downtown Feature!
Meticulously maintained systems; new boiler; newer roof
All new roads, curbs, sewer/utilities, streetscapes, etc. along Main Street
22,000 VPD on Exchange; 15,000 VPD on S. Main; 10,000 VPD on Cedar
Over 650 new apartments and over 600 student housing beds within 2 blocks
Over 2,300 housing units in core downtown and hundreds additional planned for 2021 and 2022 to meet demand
Over 60,000+ daytime population within 1 mile
Walking distance from the University of Akron (25,000 students)
Within 1.5 miles of 6 of Akron's largest employers; over 50,000 downtown Akron employees
15-year tax abatement (residential/apartments; Located within Opportunity Zone
National and regional retailer neighbors (Walgreens, Jimmy Johns, Muggswigz Coffee & Tea) and local retail staples (DaVinci's Pizza, Diamond Deli)
Close proximity to downtown amenities such as, Lock 3, Canal Park Stadium, Akron Civic Theater, Canal Place, Towpath Trail, and many retail, restaurant & entertainment
Surrounded by premier medical systems: Akron Children's Hospital, Summa Health, and Cleveland Clinic
Higher Education: The University of Akron (25,000 students) & newly constructed Stark State College (3,000 students)
Over 1,000 downtown apartments built in the last several years (demand continues to outweigh supply evidenced by low vacancy rates); over 2,300 units exist downtown Akron with additional units underway/planned 2021-2022 (new and existing sites)