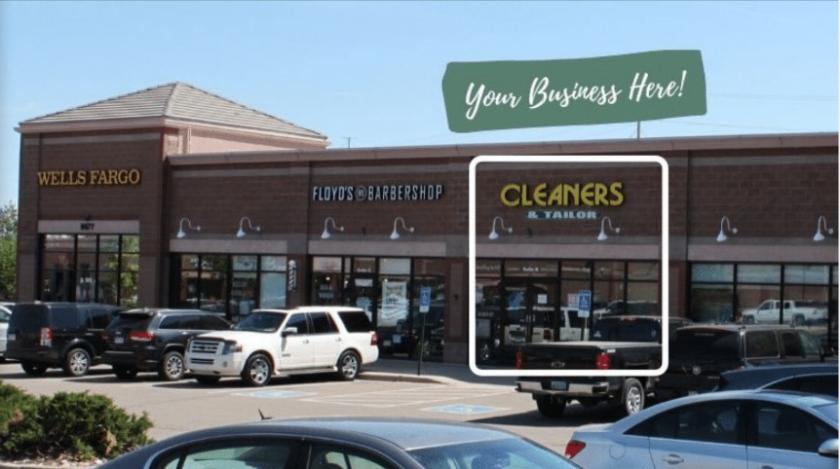
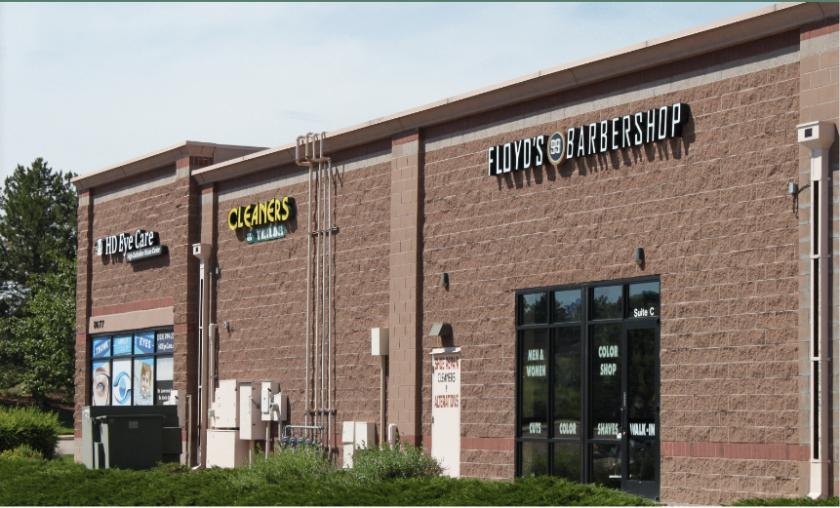
Excellent outparcel location, anchored by King Soopers in the
highly desirable Highlands Ranch community. Desirable
demographics and strong traffic counts make this a great
opportunity for convenience and service-based businesses.
The property offers ample parking and convenient access to
the entry of the center. This is an ideal traffic flow location as
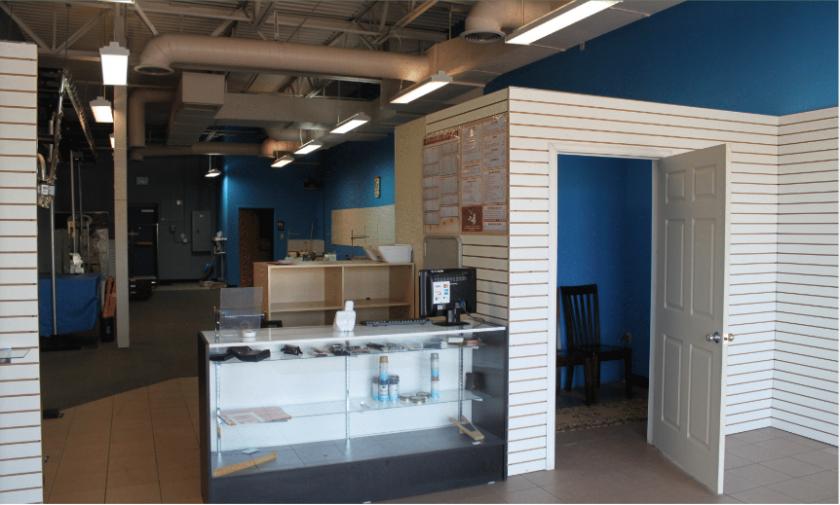
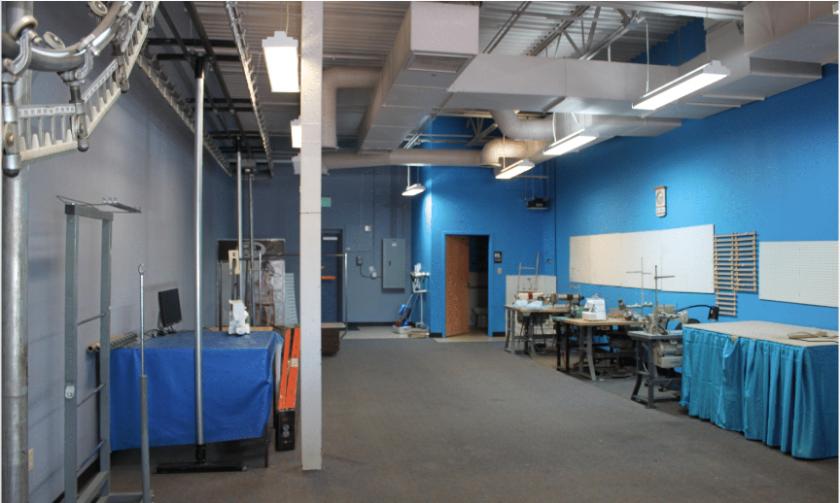
it makes this a quick in and out business location. The open
floor plan with bathrooms located in the back makes this a
flexible design for many use types.
Location Overview
Highlands Ranch is a 22,000-acre master-planned
community founded in 1981. The community has a
population of 96,000 people. It is located 12 miles south of
Denver in Douglas County and offers a wonderful quality of
life and opportunities for an active lifestyle
No part of this information may be copied, reproduced, repurposed, or screen-captured for any commercial purpose without prior written authorization from MyEListing.
While we strive to provide the most accurate information, all listing information, and demographic data, is provided by third-parties. As such, MyEListing will not be responsible for the accuracy of the information. It is strongly recommended that you verify all information with the listing agent, and any relevant agencies, prior to making any decisions.
What is the asking price for 8677 South Quebec Street in Littleton?
The asking price for 8677 South Quebec Street is $27.00 - $29.00 a SF per Year
What is the building size of this commercial Retail property?
The size of this lease property at '.8677 South Quebec Street.' is 1419 square feet
What kind of Retail is the propery at 8677 South Quebec Street?
The property at 8677 South Quebec Street Littleton, CO 80130 is listed as a Shopping Center Retail property
What is the population within 1 mile of 8677 South Quebec Street in Littleton?
The population within 1 mile of 8677 South Quebec Street Littleton, CO 80130 is 13,072 people.
Who do I contact for questions about 8677 South Quebec Street?
You should contact the listing agent,
Phil Kubat, for any details regarding this commercial listing.