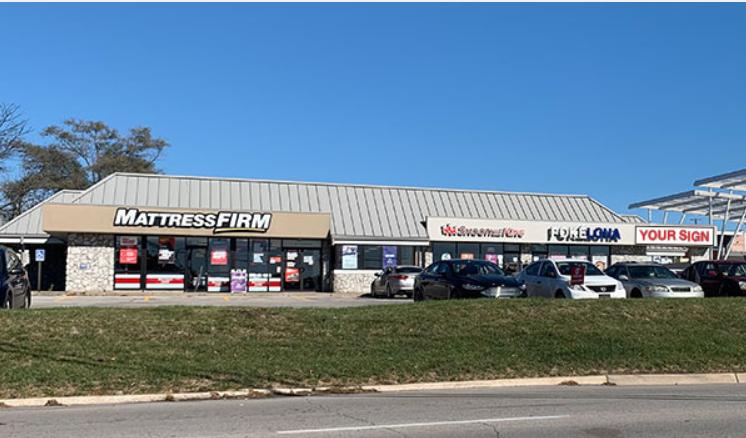
1-Mile | 3-Miles | 5-Miles | ||
---|---|---|---|---|
Total Population | 8,406 | 91,898 | 227,501 | |
Population Median Age | 41 | 40 | 40 | |
Population by Age | 0-9 Yrs | 925 (11%) | 11508 (12%) | 27170 (11%) |
10-19 Yrs | 793 (9%) | 8551 (9%) | 23321 (10%) | |
20-29 Yrs | 960 (11%) | 12268 (13%) | 32492 (14%) | |
30-39 Yrs | 1395 (16%) | 15134 (16%) | 34836 (15%) | |
40-49 Yrs | 1039 (12%) | 10018 (10%) | 24560 (10%) | |
50-59 Yrs | 1291 (15%) | 11639 (12%) | 28669 (12%) | |
60-69 Yrs | 1026 (12%) | 11979 (13%) | 29331 (12%) | |
70+ Yrs | 977 (11%) | 10800 (11%) | 27121 (11%) | |
Median HH Income | $85,887 | $76,701 | $71,866 | |
Total Household Income | < 24K | 338 (8%) | 5422 (13%) | 13922 (14%) |
25-49K | 779 (20%) | 8202 (19%) | 20945 (21%) | |
50-74K | 597 (15%) | 6537 (15%) | 16748 (16%) | |
75-99K | 511 (13%) | 5480 (13%) | 13270 (13%) | |
100-199K | 1086 (28%) | 10371 (25%) | 23404 (23%) | |
200K+ | 561 (14%) | 5057 (12%) | 10957 (11%) | |
Highest Education Level | No Diploma | 84 | 2203 | 7168 |
Diploma or GED | 797 | 9004 | 25894 | |
Some College | 1334 | 12549 | 31139 | |
Assoc. Degree | 414 | 3667 | 10075 | |
Bachelors Degree | 2226 | 23975 | 53778 | |
Higher Degree | 1509 | 16032 | 36195 | |
Total Housing Units | 4,033 | 44,574 | 108,664 | |
--Owner-Occupied | 3,180 | 27,286 | 64,816 | |
--Renter-Occupied | 692 | 13,782 | 34,431 | |
Owner-Occupied Values | < 100K | 216 | 2746 | 7630 |
100-199K | 1402 | 8235 | 21560 | |
200-299K | 353 | 6315 | 14952 | |
300-399K | 254 | 3927 | 8128 | |
400-499K | 344 | 2212 | 4383 | |
500K+ | 611 | 3851 | 8162 | |
Total Working Age Population | 6,911 | 74,693 | 186,231 | |
In Work Force | 4,990 | 52,767 | 128,364 | |
Not In Work Force | 1,921 | 21,926 | 57,867 | |
Workforce Employed | 4,897 | 51,201 | 124,110 | |
Workforce Unemployed | 85 | 1,558 | 4,177 | |
Civlian Workforce | 4,982 | 52,759 | 128,287 | |
Military Workforce | 8 | 8 | 77 | |
Total Households | 3,872 | 41,069 | 99,247 | |
Family Households | 2,176 | 23,220 | 55,913 | |
Non-Family Households | 1,696 | 17,848 | 43,334 | |
Married Couple | 1,856 | 18,046 | 42,627 | |
Other Family | 320 | 5,175 | 13,285 | |
Married w/Child | 692 | 6,927 | 15,632 | |
Single Male w/Child | 38 | 716 | 1,642 | |
Single Female w/Child | 103 | 1,984 | 5,015 |
Population Change Last Two Decades - Plus Projection
2000 | % | 2010 | % | 2020 | % | 2030 | |
---|---|---|---|---|---|---|---|
Kansas | 2,688,418 | +6 | 2,853,118 | +5 | 2,988,194 | +5 | 3,140,008 |
Johnson County | 451,086 | +21 | 544,179 | +15 | 625,524 | +17 | 734,065 |
Wyandotte County | 157,882 | 0 | 157,505 | +5 | 165,672 | +2 | 169,789 |
Missouri | 5,595,211 | +7 | 5,988,927 | +7 | 6,389,850 | +6 | 6,746,762 |
Jackson County | 654,880 | +3 | 674,158 | +2 | 689,226 | +4 | 714,467 |
Total Working Age Population:
Total Households:
Total Working Age Population:
Total Households:
Total Working Age Population:
Total Households: