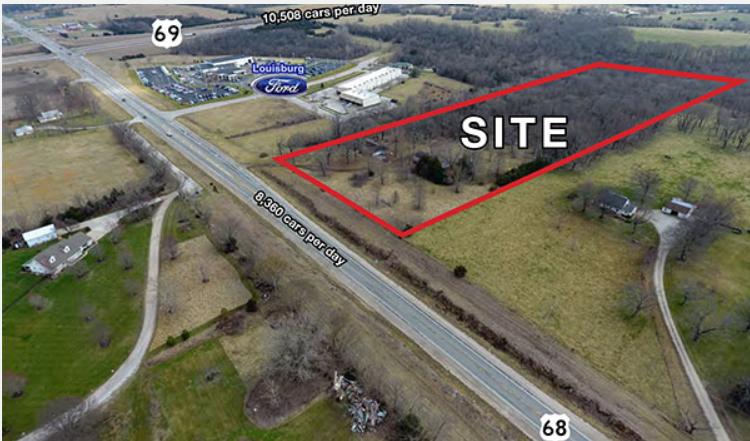
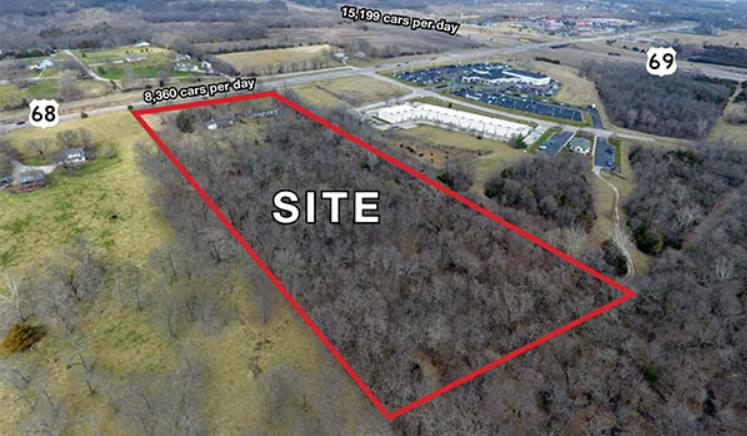
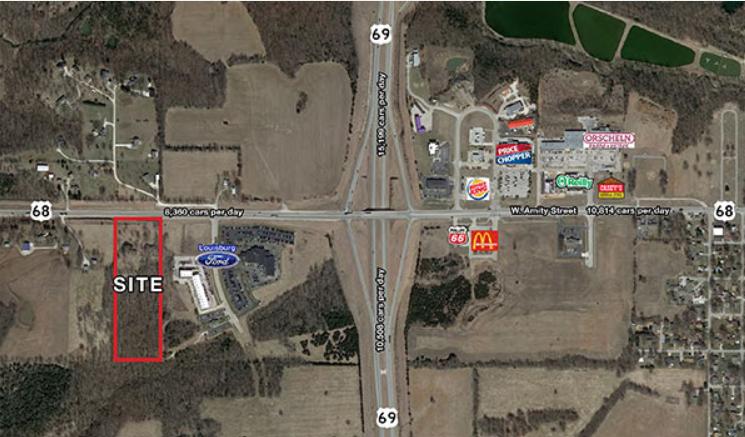
1-Mile | 3-Miles | 5-Miles | ||
---|---|---|---|---|
Total Population | 99 | 4,277 | 6,674 | |
Population Median Age | 40 | 38 | 38 | |
Population by Age | 0-9 Yrs | 13 (13%) | 517 (12%) | 829 (12%) |
10-19 Yrs | 13 (13%) | 769 (17%) | 1185 (17%) | |
20-29 Yrs | 11 (11%) | 319 (7%) | 496 (7%) | |
30-39 Yrs | 8 (8%) | 568 (13%) | 796 (11%) | |
40-49 Yrs | 13 (13%) | 692 (16%) | 1033 (15%) | |
50-59 Yrs | 15 (15%) | 588 (13%) | 970 (14%) | |
60-69 Yrs | 19 (19%) | 442 (10%) | 755 (11%) | |
70+ Yrs | 7 (7%) | 382 (8%) | 611 (9%) | |
Median HH Income | $95,371 | $72,826 | $82,696 | |
Total Household Income | < 24K | 3 (8%) | 172 (10%) | 241 (9%) |
25-49K | 4 (10%) | 403 (24%) | 492 (19%) | |
50-74K | 8 (21%) | 275 (16%) | 425 (16%) | |
75-99K | 5 (13%) | 218 (13%) | 310 (12%) | |
100-199K | 12 (32%) | 488 (29%) | 810 (32%) | |
200K+ | 5 (13%) | 102 (6%) | 229 (9%) | |
Highest Education Level | No Diploma | 2 | 138 | 179 |
Diploma or GED | 17 | 758 | 1100 | |
Some College | 13 | 814 | 1167 | |
Assoc. Degree | 8 | 297 | 497 | |
Bachelors Degree | 19 | 534 | 984 | |
Higher Degree | 10 | 282 | 476 | |
Total Housing Units | 40 | 1,804 | 2,695 | |
--Owner-Occupied | 33 | 1,235 | 1,987 | |
--Renter-Occupied | 3 | 423 | 521 | |
Owner-Occupied Values | < 100K | 3 | 92 | 126 |
100-199K | 7 | 622 | 772 | |
200-299K | 7 | 298 | 557 | |
300-399K | 5 | 79 | 179 | |
400-499K | 6 | 76 | 177 | |
500K+ | 5 | 69 | 177 | |
Total Working Age Population | 77 | 3,235 | 5,073 | |
In Work Force | 56 | 2,288 | 3,605 | |
Not In Work Force | 21 | 947 | 1,467 | |
Workforce Employed | 56 | 2,239 | 3,528 | |
Workforce Unemployed | 0 | 49 | 78 | |
Civlian Workforce | 56 | 2,288 | 3,605 | |
Military Workforce | 0 | 0 | 0 | |
Total Households | 37 | 1,659 | 2,508 | |
Family Households | 31 | 1,148 | 1,873 | |
Non-Family Households | 5 | 510 | 635 | |
Married Couple | 28 | 935 | 1,556 | |
Other Family | 3 | 213 | 316 | |
Married w/Child | 10 | 493 | 781 | |
Single Male w/Child | 0 | 53 | 69 | |
Single Female w/Child | 1 | 97 | 122 |
Population Change Last Two Decades - Plus Projection
2000 | % | 2010 | % | 2020 | % | 2030 | |
---|---|---|---|---|---|---|---|
Kansas | 2,688,418 | +6 | 2,853,118 | +5 | 2,988,194 | +5 | 3,140,008 |
Miami County | 28,351 | +16 | 32,787 | +2 | 33,582 | +4 | 35,007 |
Total Working Age Population:
Total Households:
Total Working Age Population:
Total Households:
Total Working Age Population:
Total Households: