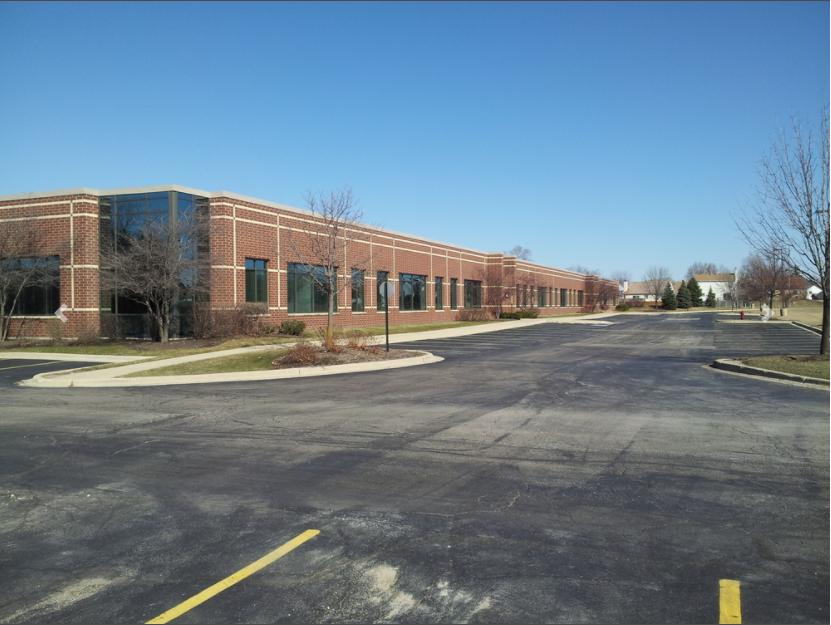
The subject property is a 46,624-square foot, single-story, Class A building built in 2003 located in Woodridge, Illinois in the county of DuPage. This was a built to suit for two tenants. The tenants were Brach's Candy Corporate Offices and EN Engineering (A joint venture between A. Epstein & Sons and Nicor Gas). The property was built by McShane Development who developed the Midpoint Corporate Park, After Brach's Candy left to move to Mexico, EN took over the building and they moved out in 2013 as they needed to double their space.
Presently the building is 100% vacant. The building was built with high-quality finishes and features solid masonry construction with architectural window and masonry details. A special HVAC was built to handle a computer mainframe area for the tenants. The interior perimeter was built out with offices while the middle of the interior has an open floor plate to allow for installation of cubicle workspaces. Ample parking is on-site on both the east and west side of the building. The building also features a loading dock on the west side of the building. The building is fully sprinkled and has 10-foot high drop ceilings and floor to bottom of deck is 16 feet. The building would be perfect for owner/user who could occupy 50% of the building or 100% of the building. The property's present RE taxes are about $1.70 PSF. The property is part of a Business Park Association which property share was $9700 in 2020. The property is being sold "AS-IS". with no reps or warrants. The City just passed a new special use in the ORI zoning for private and public schools , colleges and universities.
The City of Woodridge will be building a new police headquarters and Maintenance Facilty on the 5-acres vacant land on the south side of the property.
Highlights
Class A Building Built in 2003 as a Built to Suit; Presently 100 Percent Vacant
Great Location Just West of Interstate-355 at 75th Street
DuPage County Taxes
Building Can Be Used for a Single Tenant, or Two Tenants
Building Features Special Air Conditioning for Computer Main Frame Area
Interior Perimeter has Built Out Offices, Drop Ceilings are 10 Feet Tall
Middle of Interior of Building Features Open Space for Cubicles
Building is 100 Percent Sprinkled and Features a Loading Dock
Great potentia lfor redevlopment to Industrial Warehosuine, Self Storage or private or public School
No part of this information may be copied, reproduced, repurposed, or screen-captured for any commercial purpose without prior written authorization from MyEListing.
While we strive to provide the most accurate information, all listing information, and demographic data, is provided by third-parties. As such, MyEListing will not be responsible for the accuracy of the information. It is strongly recommended that you verify all information with the listing agent, and any relevant agencies, prior to making any decisions.
What is the asking price for 7135 Janes Avenue in Woodridge?
The asking price for 7135 Janes Avenue is $2,600,000
What is the building size of this Office property in Woodridge, IL?
The size of the building/unit at 7135 Janes Avenue in Woodridge is 46,624 square feet
How much land does the Woodridge, IL property at 7135 Janes Avenue include?
7135 Janes Avenue in Woodridge includes 3.560 acres of land
What kind of Office is the propery at 7135 Janes Avenue?
The property at 7135 Janes Avenue Woodridge, IL 60517 is listed as a Professional Office property
What is the population within 1 mile of 7135 Janes Avenue in Woodridge?
The population within 1 mile of 7135 Janes Avenue Woodridge, IL 60517 is 14,808 people.
Who do I contact for questions about 7135 Janes Avenue?
You should contact the listing agent,
Nicholas Manganais, for any details regarding this commercial listing.