SVN has been retained to lease Suite 16113 in the LaSalle Park Medical Office Buildings. The suite is 1,150 square feet and was previously used as a Pharmacy.
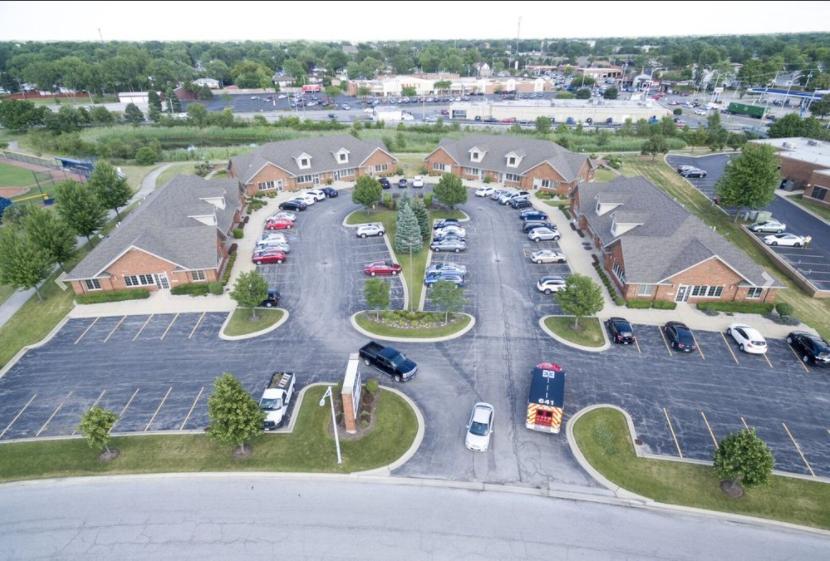
LaSalle Office Park is a newer development built in 2005/2006 of 4 free-standing buildings in a cul-de-sac and part of a master plan of a Medical/Office development called College Park. The four buildings consist of 2- 3 unit suites and 2 - 4 unit suites. Each suite has had extensive high-end buildout done. Each building has 4,953 square feet of rental space. The property is presently under the Class 8 status for RE taxes that will expire in 2026.
The building is occupied by a majority of Medical Health Care or Social Service providers.
Highlights
Newer Construction 2005/06
4 Buildings-Two with 3 tenant suites and Two with 4 tenant suites.
Buildings located in a Cul-De-Sac design development
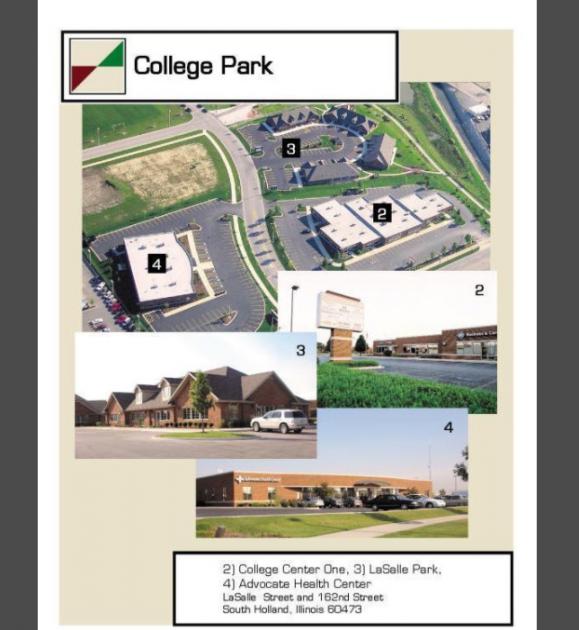
LaSalle Park is part of a Medical/Office development including College Center One, an office property, a Free Standing Advocate Medical Health facility, and a Free standing Davita Health Renal Center.
High End Medical/Office Suites
Class 8 status for RE Taxes until 2026
No part of this information may be copied, reproduced, repurposed, or screen-captured for any commercial purpose without prior written authorization from MyEListing.
While we strive to provide the most accurate information, all listing information, and demographic data, is provided by third-parties. As such, MyEListing will not be responsible for the accuracy of the information. It is strongly recommended that you verify all information with the listing agent, and any relevant agencies, prior to making any decisions.
What is the asking price for 16113 La Salle Street in South Holland?
The asking price for 16113 La Salle Street is $25.04 a SF per Year
What is the building size of this commercial Office property?
The size of this lease property at '.16113 La Salle Street.' is 1150 square feet
What kind of Office is the propery at 16113 La Salle Street?
The property at 16113 La Salle Street South Holland, IL 60473 is listed as a Medical Office property
What is the population within 1 mile of 16113 La Salle Street in South Holland?
The population within 1 mile of 16113 La Salle Street South Holland, IL 60473 is 10,177 people.
Who do I contact for questions about 16113 La Salle Street?
You should contact the listing agent,
Nicholas Manganais, for any details regarding this commercial listing.