SVN is pleased to present for lease office spaces at the US Bank building at 1350 E. Sibley Blvd in Dolton, Illinois Cook County. The building is a 5 story elevator building that features US Bank on the ground level first Floor and multiple tenants on floors 2 through 4 and a vacant penthouse space on the top 5th floor. The property is aided by its large onsite parking lot.
Ownership is flexible in combing office spaces as needed by new tenants at the present time. Spaces range for 430 SF to 3,780 SF and multiple levels can be leased by one tenant.
Highlights
Great location just off the I-94 interstate at Sibley Blvd.
Large on-site parking field
1st Floor anchored by US Bank Branch with drive-up windows.
Elevator Building
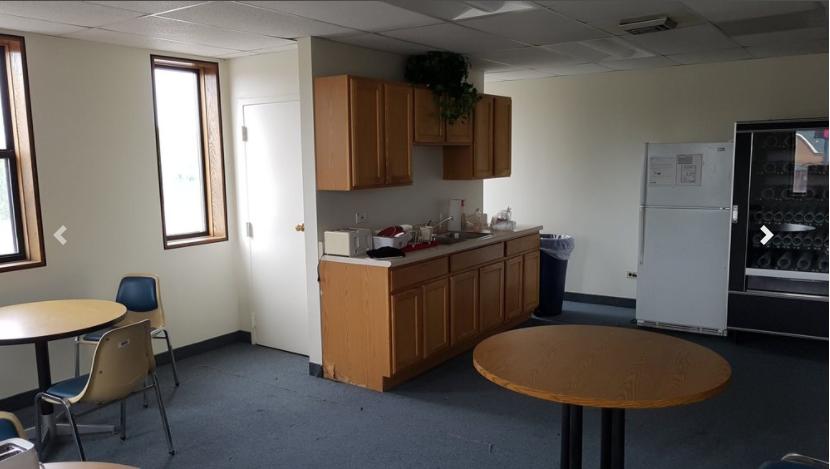
2nd floor features common break room
Top 5th floor is a penthouse type space
No part of this information may be copied, reproduced, repurposed, or screen-captured for any commercial purpose without prior written authorization from MyEListing.
While we strive to provide the most accurate information, all listing information, and demographic data, is provided by third-parties. As such, MyEListing will not be responsible for the accuracy of the information. It is strongly recommended that you verify all information with the listing agent, and any relevant agencies, prior to making any decisions.
What is the building size of this commercial Office property?
The size of this multi-unit property varies between 430 - 2954 square feet
What kind of Office is the propery at 14975 Lincoln Avenue?
The property at 14975 Lincoln Avenue Dolton, IL 60419 is listed as a Professional Office property
What is the population within 1 mile of 14975 Lincoln Avenue in Dolton?
The population within 1 mile of 14975 Lincoln Avenue Dolton, IL 60419 is 21,146 people.
Who do I contact for questions about 14975 Lincoln Avenue?
You should contact the listing agent,
Nicholas Manganais, for any details regarding this commercial listing.