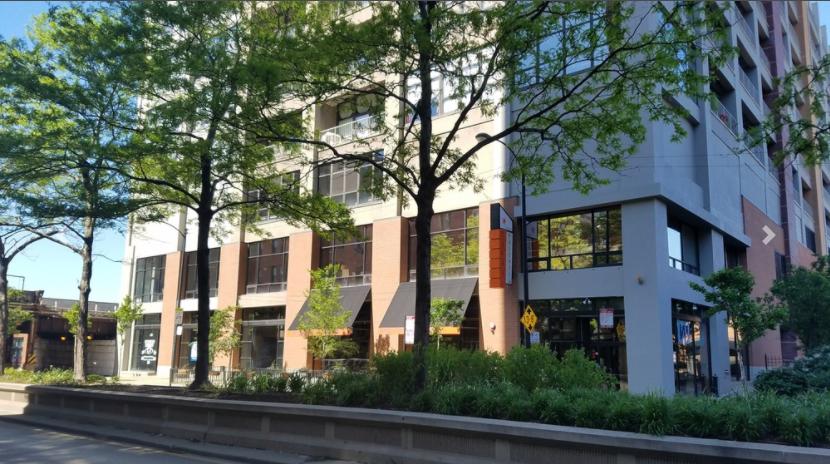
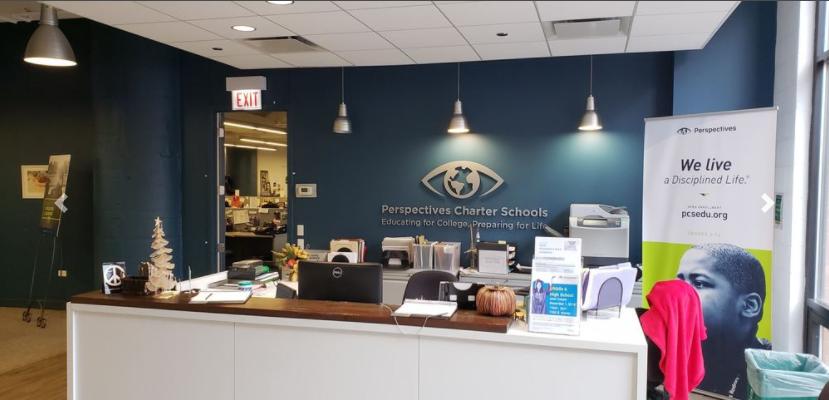
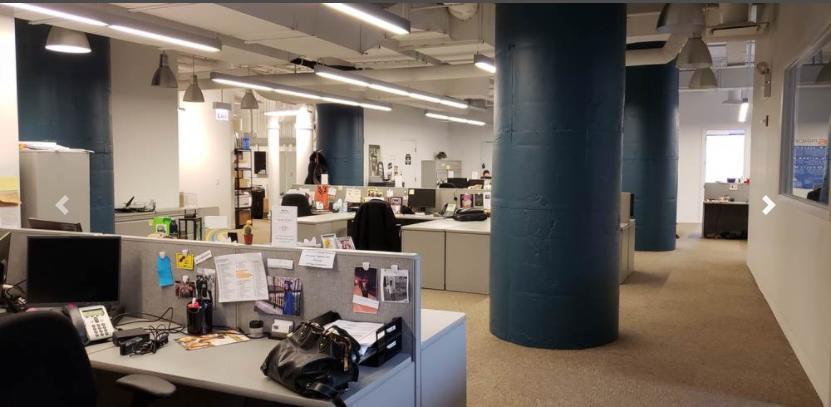
SVN Chicago Commercial is pleased to bring to market a multi-tenant office, retail and communications commercial property investment offering for sale in the luxury residential condo building known as Dearborn Tower, located in the heart of Chicago's booming South Loop neighborhood. This approx. 11,000 SF property is comprised of approx. 9700 SF of 2nd floor office space, an additional two service retail spaces totaling approx 1,000 SF, communications risers and roof rights with leases from antenna & satellite TV providers as well as an internet license with the Dearborn Tower condo association. Additional space utilized for commercial tenant parking in the basement of the parking garage is also included in the offering. The 2nd floor office portion of the property is on a long term lease with Perspectives Charter Schools, one of Chicago's most prominent charter school organizations. The remaining tenant roster is comprised of a dry cleaner, a non-for profit group, the condo association, which leases rooftop & basement space for internet services to its residences, and two communications companies providing both satellite and internet services to the building's residences. The leases include annual escalations and there is partial real estate tax recovery from Perspectives Charter School. This investment has a scheduled NOI of $159,170 and is being offered at a CAP rate of 7.58%. 16 deeded parking spaces are also available for purchase at an additional cost.HighlightsOffice/Retail/Communications InvestmentApprox. 11,000 SF of office & retail + communication risers, roof rights & basement spacePart of 317 unit Dearborn Tower condo buildingConvenient South Loop locationLong term leasesFor Sale at $2,100,000Projected NOI of $159,170Offering CAP rate of 7.58%16 parking spaces also available for sale at $410,000