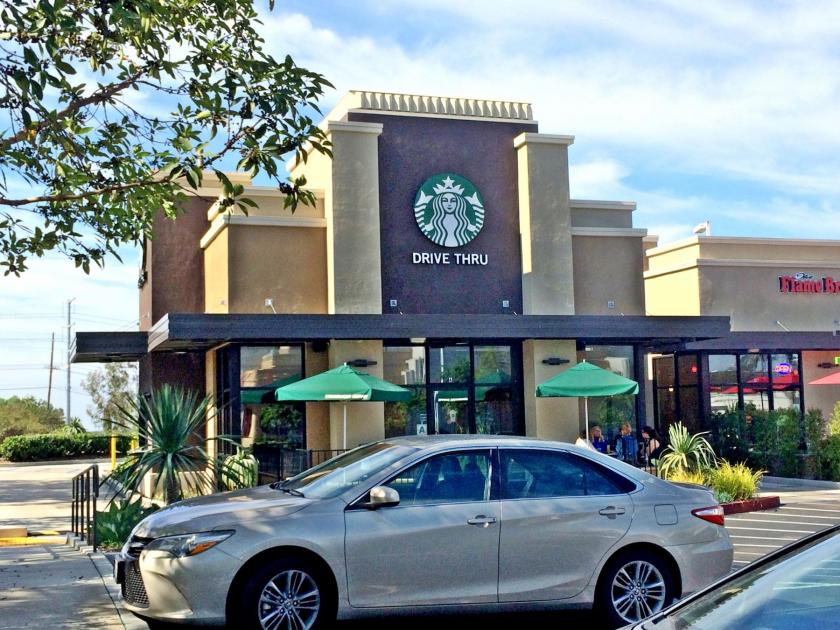
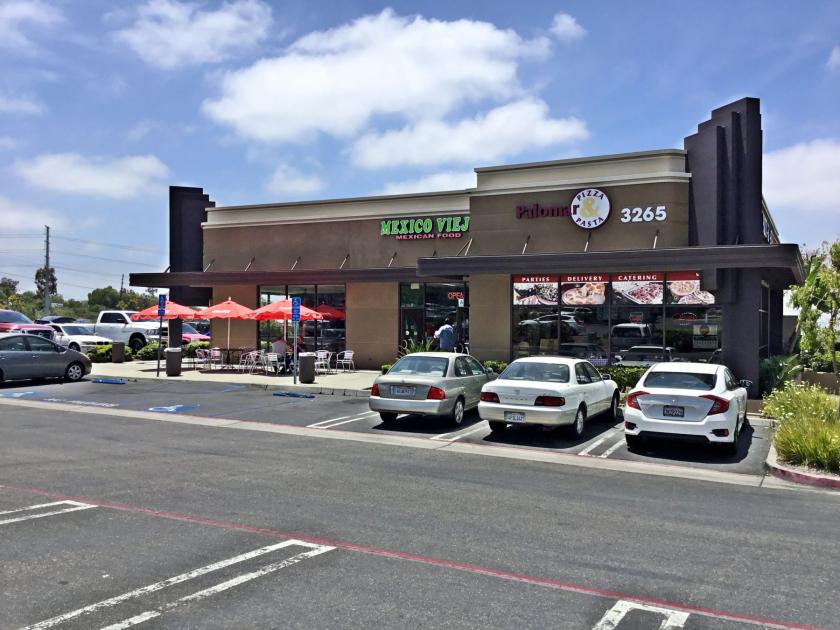
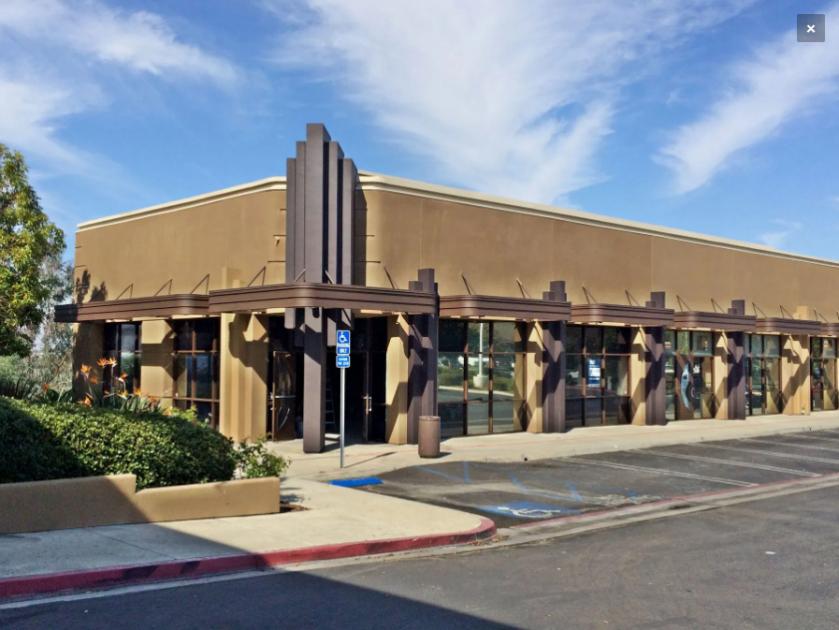
1-Mile | 3-Miles | 5-Miles | ||
---|---|---|---|---|
Total Population | 9,154 | 90,746 | 237,513 | |
Population Median Age | 41 | 39 | 38 | |
Population by Age | 0-9 Yrs | 1351 (14%) | 12015 (13%) | 32847 (13%) |
10-19 Yrs | 1189 (12%) | 12461 (13%) | 32577 (13%) | |
20-29 Yrs | 533 (5%) | 9376 (10%) | 27584 (11%) | |
30-39 Yrs | 1142 (12%) | 12116 (13%) | 30905 (13%) | |
40-49 Yrs | 1302 (14%) | 12236 (13%) | 32617 (13%) | |
50-59 Yrs | 1138 (12%) | 11705 (12%) | 31252 (13%) | |
60-69 Yrs | 1283 (14%) | 9878 (10%) | 23977 (10%) | |
70+ Yrs | 1217 (13%) | 10959 (12%) | 25755 (10%) | |
Median HH Income | $98,721 | $88,801 | $94,813 | |
Total Household Income | < 24K | 553 (16%) | 3997 (12%) | 8529 (10%) |
25-49K | 465 (13%) | 5214 (16%) | 12352 (15%) | |
50-74K | 292 (8%) | 4936 (15%) | 12163 (15%) | |
75-99K | 398 (11%) | 3700 (11%) | 9353 (11%) | |
100-199K | 1038 (30%) | 9749 (30%) | 24822 (30%) | |
200K+ | 629 (18%) | 4783 (14%) | 13695 (16%) | |
Highest Education Level | No Diploma | 607 | 6622 | 16734 |
Diploma or GED | 978 | 9943 | 25194 | |
Some College | 1259 | 12783 | 32823 | |
Assoc. Degree | 507 | 5515 | 12922 | |
Bachelors Degree | 1949 | 17041 | 43795 | |
Higher Degree | 1168 | 10118 | 27727 | |
Total Housing Units | 3,464 | 34,283 | 85,632 | |
--Owner-Occupied | 2,582 | 21,490 | 52,210 | |
--Renter-Occupied | 791 | 10,889 | 28,705 | |
Owner-Occupied Values | < 100K | 173 | 1003 | 1800 |
100-199K | 262 | 842 | 1473 | |
200-299K | 157 | 910 | 1825 | |
300-399K | 164 | 1208 | 3332 | |
400-499K | 398 | 3365 | 7180 | |
500K+ | 1428 | 14162 | 36599 | |
Total Working Age Population | 7,151 | 71,349 | 184,771 | |
In Work Force | 4,419 | 45,505 | 120,005 | |
Not In Work Force | 2,732 | 25,843 | 64,766 | |
Workforce Employed | 4,292 | 43,459 | 113,629 | |
Workforce Unemployed | 112 | 1,718 | 5,395 | |
Civlian Workforce | 4,404 | 45,177 | 119,024 | |
Military Workforce | 15 | 328 | 981 | |
Total Households | 3,373 | 32,379 | 80,914 | |
Family Households | 2,345 | 23,015 | 59,673 | |
Non-Family Households | 1,028 | 9,364 | 21,241 | |
Married Couple | 2,005 | 18,088 | 47,112 | |
Other Family | 340 | 4,927 | 12,561 | |
Married w/Child | 1,010 | 8,296 | 22,123 | |
Single Male w/Child | 29 | 644 | 1,755 | |
Single Female w/Child | 108 | 1,751 | 4,450 |
Population Change Last Two Decades - Plus Projection
2000 | % | 2010 | % | 2020 | % | 2030 | |
---|---|---|---|---|---|---|---|
California | 33,871,648 | +10 | 37,253,956 | +9 | 40,467,295 | +8 | 43,631,295 |
San Diego County | 2,813,833 | +10 | 3,095,313 | +10 | 3,390,529 | +6 | 3,608,286 |
Total Working Age Population:
Total Households:
Total Working Age Population:
Total Households:
Total Working Age Population:
Total Households: