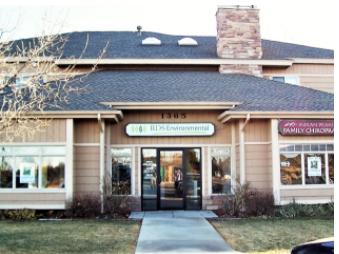
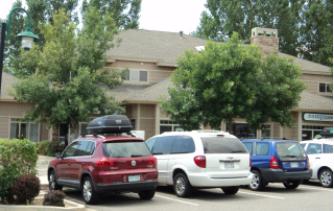
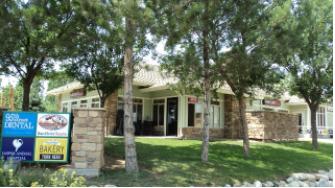
1-Mile | 3-Miles | 5-Miles | ||
---|---|---|---|---|
Total Population | 2,856 | 41,846 | 87,119 | |
Population Median Age | 43 | 40 | 40 | |
Population by Age | 0-9 Yrs | 263 (9%) | 5479 (13%) | 10729 (12%) |
10-19 Yrs | 504 (17%) | 5388 (12%) | 10608 (12%) | |
20-29 Yrs | 124 (4%) | 3882 (9%) | 9422 (10%) | |
30-39 Yrs | 220 (7%) | 5481 (13%) | 11457 (13%) | |
40-49 Yrs | 447 (15%) | 5944 (14%) | 12418 (14%) | |
50-59 Yrs | 511 (17%) | 6179 (14%) | 12929 (14%) | |
60-69 Yrs | 505 (17%) | 5579 (13%) | 11425 (13%) | |
70+ Yrs | 282 (9%) | 3915 (9%) | 8132 (9%) | |
Median HH Income | $140,320 | $95,587 | $99,383 | |
Total Household Income | < 24K | 66 (5%) | 1612 (9%) | 3195 (9%) |
25-49K | 109 (9%) | 2525 (15%) | 5060 (14%) | |
50-74K | 120 (10%) | 2153 (12%) | 4364 (12%) | |
75-99K | 116 (10%) | 2429 (14%) | 4713 (13%) | |
100-199K | 365 (32%) | 4970 (29%) | 11240 (32%) | |
200K+ | 348 (30%) | 2892 (17%) | 5860 (17%) | |
Highest Education Level | No Diploma | 30 | 1060 | 2249 |
Diploma or GED | 134 | 3278 | 6920 | |
Some College | 233 | 4452 | 9312 | |
Assoc. Degree | 74 | 1793 | 3777 | |
Bachelors Degree | 828 | 10513 | 22285 | |
Higher Degree | 747 | 8165 | 17432 | |
Total Housing Units | 1,160 | 17,284 | 35,718 | |
--Owner-Occupied | 1,014 | 12,704 | 26,125 | |
--Renter-Occupied | 109 | 3,878 | 8,307 | |
Owner-Occupied Values | < 100K | 21 | 570 | 1141 |
100-199K | 8 | 282 | 626 | |
200-299K | 29 | 957 | 1894 | |
300-399K | 74 | 1892 | 3924 | |
400-499K | 87 | 2423 | 4875 | |
500K+ | 795 | 6579 | 13665 | |
Total Working Age Population | 2,248 | 32,817 | 69,509 | |
In Work Force | 1,510 | 23,267 | 48,171 | |
Not In Work Force | 738 | 9,550 | 21,338 | |
Workforce Employed | 1,455 | 22,438 | 46,453 | |
Workforce Unemployed | 56 | 815 | 1,704 | |
Civlian Workforce | 1,510 | 23,253 | 48,157 | |
Military Workforce | 0 | 14 | 14 | |
Total Households | 1,123 | 16,582 | 34,431 | |
Family Households | 870 | 10,910 | 22,948 | |
Non-Family Households | 253 | 5,671 | 11,483 | |
Married Couple | 753 | 8,875 | 18,968 | |
Other Family | 117 | 2,035 | 3,980 | |
Married w/Child | 340 | 4,157 | 8,513 | |
Single Male w/Child | 31 | 388 | 713 | |
Single Female w/Child | 39 | 745 | 1,495 |
Population Change Last Two Decades - Plus Projection
2000 | % | 2010 | % | 2020 | % | 2030 | |
---|---|---|---|---|---|---|---|
Colorado | 4,301,261 | +17 | 5,029,196 | +16 | 5,838,181 | +15 | 6,733,658 |
Adams County | 363,857 | +21 | 441,603 | +20 | 530,680 | +21 | 642,318 |
Boulder County | 291,288 | +1 | 294,567 | +13 | 332,134 | +12 | 370,618 |
Broomfield County | 0 | 55,889 | +32 | 73,822 | +28 | 94,282 | |
Weld County | 180,936 | +40 | 252,825 | +32 | 333,149 | +36 | 453,421 |
Total Working Age Population:
Total Households:
Total Working Age Population:
Total Households:
Total Working Age Population:
Total Households: