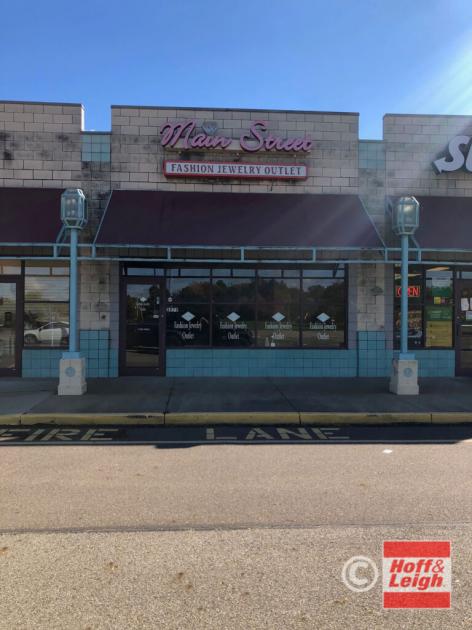
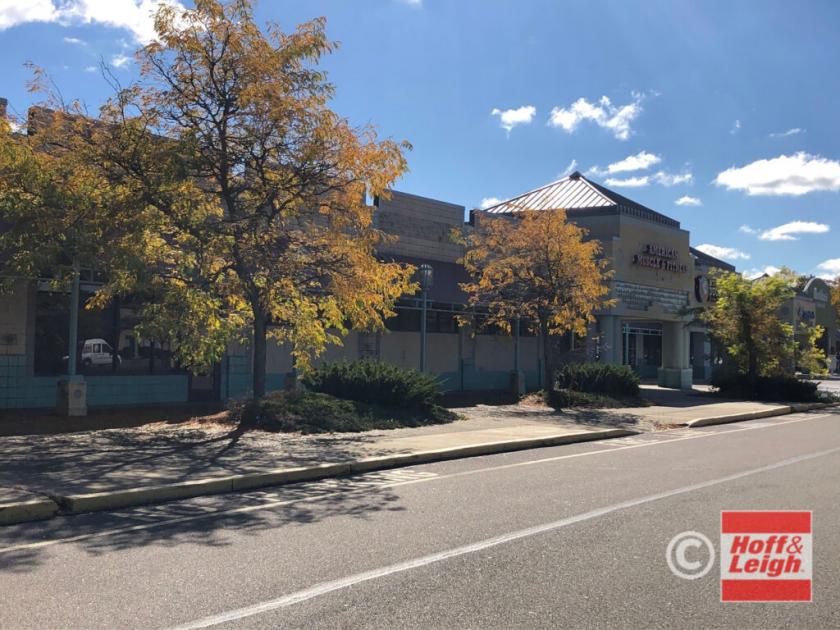
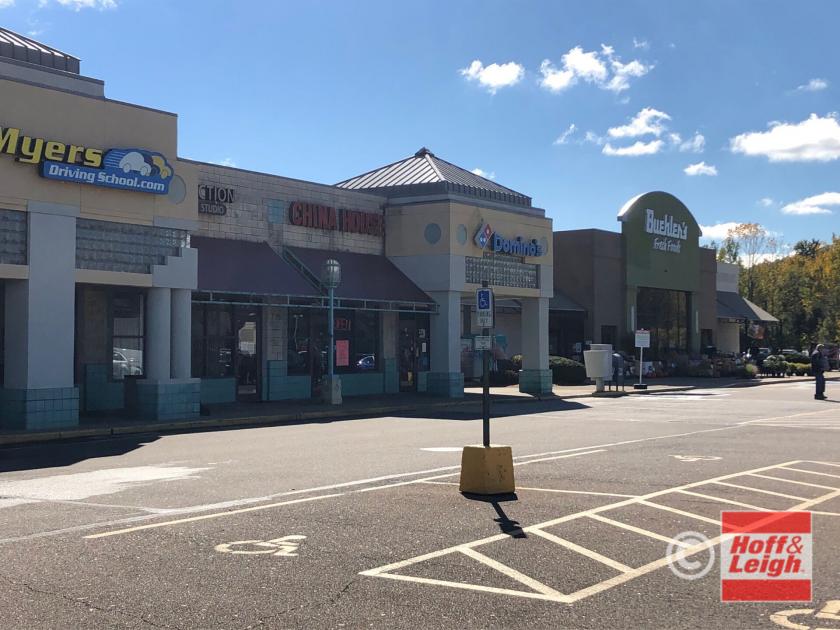
1-Mile | 3-Miles | 5-Miles | ||
---|---|---|---|---|
Total Population | 4,832 | 30,984 | 100,437 | |
Population Median Age | 43 | 42 | 41 | |
Population by Age | 0-9 Yrs | 518 (10%) | 3185 (10%) | 12022 (11%) |
10-19 Yrs | 514 (10%) | 3409 (11%) | 11473 (11%) | |
20-29 Yrs | 452 (9%) | 3860 (12%) | 13320 (13%) | |
30-39 Yrs | 674 (13%) | 3734 (12%) | 12288 (12%) | |
40-49 Yrs | 683 (14%) | 3797 (12%) | 11355 (11%) | |
50-59 Yrs | 610 (12%) | 4497 (14%) | 14970 (14%) | |
60-69 Yrs | 664 (13%) | 4530 (14%) | 13335 (13%) | |
70+ Yrs | 717 (14%) | 3972 (12%) | 11675 (11%) | |
Median HH Income | $71,311 | $66,563 | $51,303 | |
Total Household Income | < 24K | 219 (10%) | 2063 (15%) | 9951 (23%) |
25-49K | 525 (25%) | 2697 (20%) | 10870 (25%) | |
50-74K | 304 (14%) | 2522 (19%) | 7956 (18%) | |
75-99K | 301 (14%) | 2095 (15%) | 5650 (13%) | |
100-199K | 493 (24%) | 2981 (22%) | 6963 (16%) | |
200K+ | 194 (9%) | 749 (5%) | 1217 (2%) | |
Highest Education Level | No Diploma | 130 | 1210 | 6540 |
Diploma or GED | 955 | 6850 | 25992 | |
Some College | 892 | 5131 | 15790 | |
Assoc. Degree | 270 | 1907 | 6529 | |
Bachelors Degree | 924 | 4993 | 10893 | |
Higher Degree | 376 | 2407 | 5062 | |
Total Housing Units | 2,288 | 14,549 | 46,803 | |
--Owner-Occupied | 1,607 | 9,601 | 27,885 | |
--Renter-Occupied | 430 | 3,507 | 14,721 | |
Owner-Occupied Values | < 100K | 280 | 1627 | 11276 |
100-199K | 659 | 4720 | 10626 | |
200-299K | 339 | 1691 | 3453 | |
300-399K | 230 | 914 | 1534 | |
400-499K | 24 | 262 | 435 | |
500K+ | 75 | 385 | 561 | |
Total Working Age Population | 4,008 | 25,673 | 81,421 | |
In Work Force | 2,489 | 17,112 | 51,854 | |
Not In Work Force | 1,520 | 8,561 | 29,567 | |
Workforce Employed | 2,414 | 16,439 | 48,734 | |
Workforce Unemployed | 74 | 673 | 3,036 | |
Civlian Workforce | 2,489 | 17,112 | 51,770 | |
Military Workforce | 0 | 0 | 84 | |
Total Households | 2,037 | 13,107 | 42,606 | |
Family Households | 1,313 | 8,117 | 25,742 | |
Non-Family Households | 725 | 4,991 | 16,864 | |
Married Couple | 1,120 | 6,424 | 17,310 | |
Other Family | 192 | 1,693 | 8,432 | |
Married w/Child | 357 | 1,863 | 5,110 | |
Single Male w/Child | 15 | 431 | 1,457 | |
Single Female w/Child | 111 | 555 | 3,375 |
Population Change Last Two Decades - Plus Projection
2000 | % | 2010 | % | 2020 | % | 2030 | |
---|---|---|---|---|---|---|---|
Ohio | 11,353,140 | +2 | 11,536,504 | 0 | 11,574,870 | 0 | 11,615,100 |
Stark County | 378,098 | -1 | 375,586 | -2 | 368,210 | -2 | 361,130 |
Summit County | 542,899 | 0 | 541,781 | -1 | 534,150 | -1 | 528,990 |
Total Working Age Population:
Total Households:
Total Working Age Population:
Total Households:
Total Working Age Population:
Total Households: