Industrial Properties
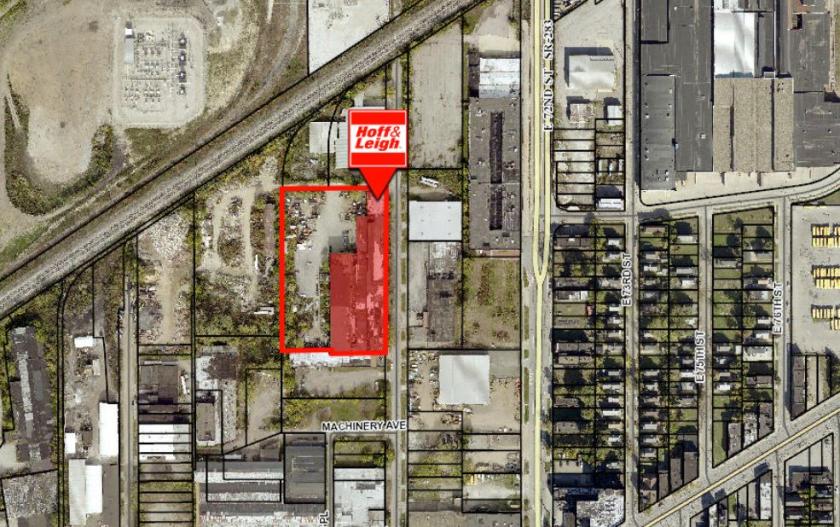
888 East 70th Street Cleveland, OH 44103
888 East 70th Street Cleveland, OH 44103
Details & Description
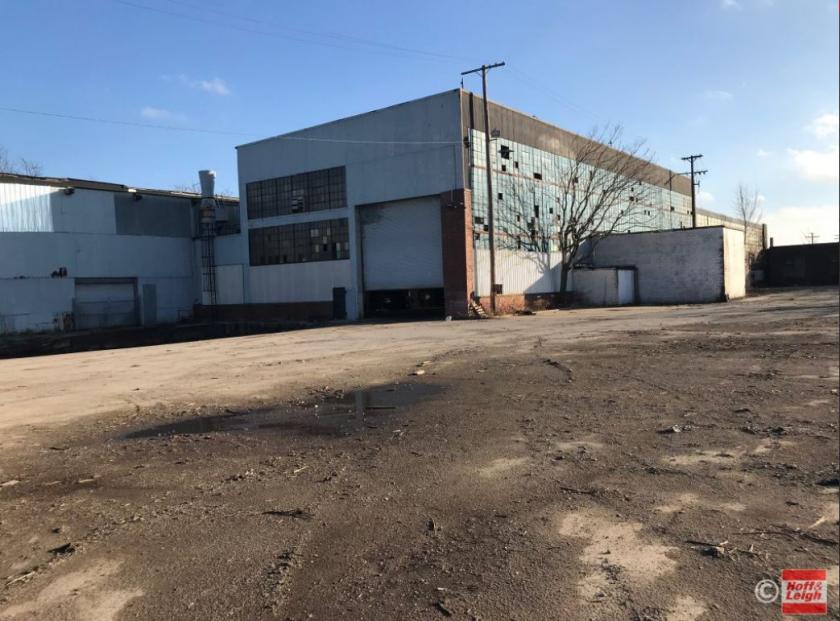
Additional Photos


Listing Agents

Joe Zumpano
O: 330-940-9360
M: 330-990-0847
jzumpano@hoffleigh.com
O: 330-940-9360
M: 330-990-0847
jzumpano@hoffleigh.com
While we strive to provide the most accurate information, all listing information, and demographic data, is provided by third-parties. As such, MyEListing will not be responsible for the accuracy of the information. It is strongly recommended that you verify all information with the listing agent, and any relevant agencies, prior to making any decisions.


