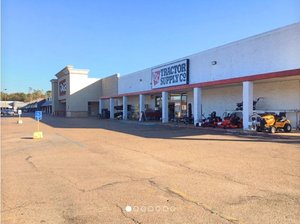
1-Mile | 3-Miles | 5-Miles | ||
---|---|---|---|---|
Total Population | 3,774 | 24,342 | 94,152 | |
Population Median Age | 32 | 38 | 37 | |
Population by Age | 0-9 Yrs | 562 (14%) | 3484 (14%) | 12694 (13%) |
10-19 Yrs | 724 (19%) | 3243 (13%) | 12901 (13%) | |
20-29 Yrs | 652 (17%) | 3496 (14%) | 14690 (15%) | |
30-39 Yrs | 595 (15%) | 2894 (11%) | 12657 (13%) | |
40-49 Yrs | 327 (8%) | 2269 (9%) | 9328 (9%) | |
50-59 Yrs | 429 (11%) | 3494 (14%) | 12213 (12%) | |
60-69 Yrs | 347 (9%) | 2675 (10%) | 10488 (11%) | |
70+ Yrs | 138 (3%) | 2788 (11%) | 9180 (9%) | |
Median HH Income | $23,868 | $26,565 | $31,706 | |
Total Household Income | < 24K | 566 (52%) | 4363 (47%) | 15196 (40%) |
25-49K | 240 (22%) | 2105 (22%) | 9154 (24%) | |
50-74K | 160 (14%) | 1143 (12%) | 5612 (15%) | |
75-99K | 53 (4%) | 620 (6%) | 3281 (8%) | |
100-199K | 61 (5%) | 619 (6%) | 3172 (8%) | |
200K+ | 9 (0%) | 308 (3%) | 919 (2%) | |
Highest Education Level | No Diploma | 438 | 3211 | 11051 |
Diploma or GED | 991 | 5940 | 20929 | |
Some College | 438 | 3681 | 14905 | |
Assoc. Degree | 116 | 855 | 4411 | |
Bachelors Degree | 162 | 1387 | 6641 | |
Higher Degree | 59 | 927 | 4574 | |
Total Housing Units | 1,195 | 11,627 | 46,029 | |
--Owner-Occupied | 358 | 3,874 | 16,005 | |
--Renter-Occupied | 731 | 5,284 | 21,329 | |
Owner-Occupied Values | < 100K | 310 | 1706 | 6187 |
100-199K | 38 | 1387 | 6266 | |
200-299K | 9 | 444 | 2111 | |
300-399K | 0 | 215 | 772 | |
400-499K | 0 | 23 | 187 | |
500K+ | 0 | 100 | 482 | |
Total Working Age Population | 2,769 | 18,962 | 73,226 | |
In Work Force | 1,176 | 8,976 | 39,545 | |
Not In Work Force | 1,593 | 9,987 | 33,681 | |
Workforce Employed | 1,063 | 8,219 | 35,785 | |
Workforce Unemployed | 113 | 669 | 3,114 | |
Civlian Workforce | 1,176 | 8,888 | 38,899 | |
Military Workforce | 0 | 88 | 646 | |
Total Households | 1,088 | 9,158 | 37,334 | |
Family Households | 738 | 5,008 | 21,151 | |
Non-Family Households | 350 | 4,149 | 16,184 | |
Married Couple | 219 | 2,244 | 10,967 | |
Other Family | 519 | 2,764 | 10,183 | |
Married w/Child | 69 | 713 | 3,818 | |
Single Male w/Child | 121 | 358 | 1,132 | |
Single Female w/Child | 240 | 1,114 | 4,116 |
Population Change Last Two Decades - Plus Projection
2000 | % | 2010 | % | 2020 | % | 2030 | |
---|---|---|---|---|---|---|---|
Louisiana | 4,468,976 | +1 | 4,533,372 | +1 | 4,588,310 | +5 | 4,813,420 |
Bossier Parish | 98,310 | +19 | 116,979 | +8 | 126,780 | +11 | 141,350 |
Caddo Parish | 252,161 | +1 | 254,969 | -6 | 240,880 | -4 | 231,790 |
Total Working Age Population:
Total Households:
Total Working Age Population:
Total Households:
Total Working Age Population:
Total Households: