Industrial Properties
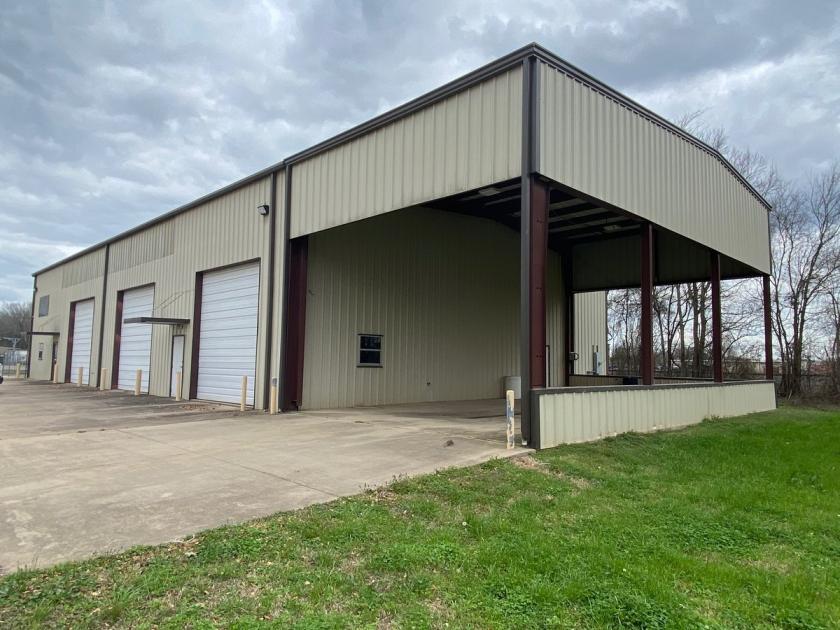
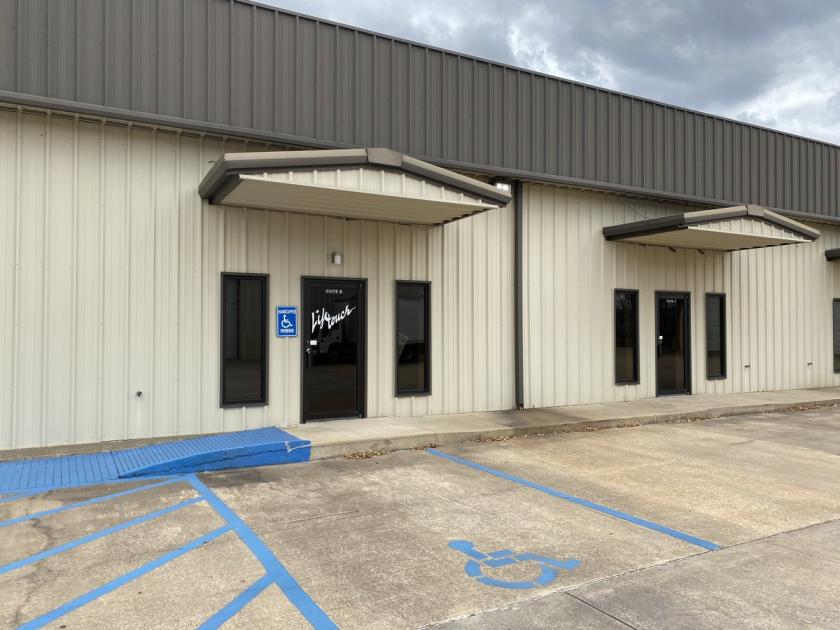
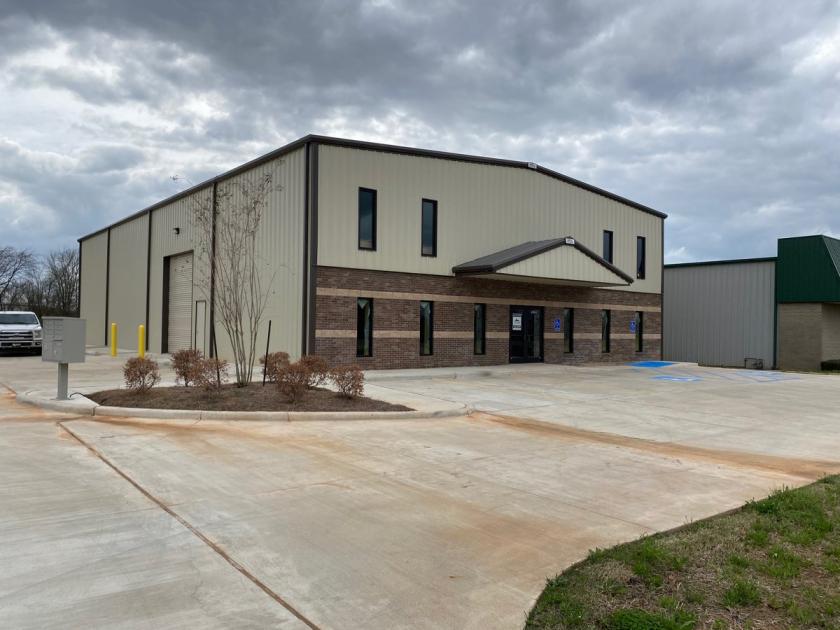
4708 Viking Drive Bossier City, LA 71111
4708 Viking Drive Bossier City, LA 71111
Details & Description
Listing Agents

Archer Frierson
O: 318-222-2244
gfrierson@vintagerealty.com
O: 318-222-2244
gfrierson@vintagerealty.com
While we strive to provide the most accurate information, all listing information, and demographic data, is provided by third-parties. As such, MyEListing will not be responsible for the accuracy of the information. It is strongly recommended that you verify all information with the listing agent, and any relevant agencies, prior to making any decisions.