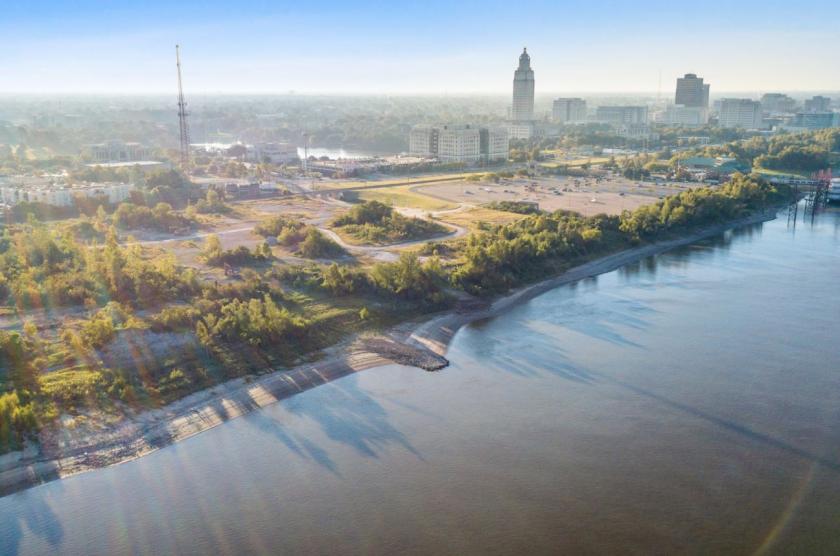
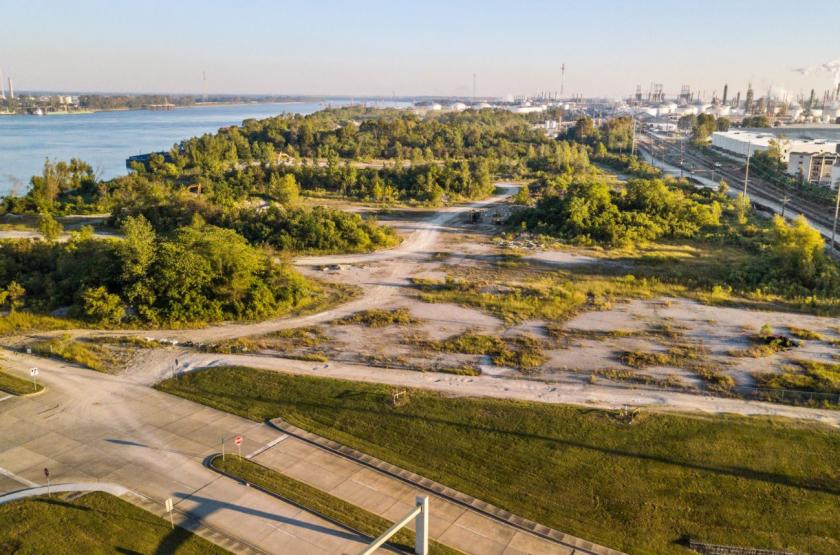
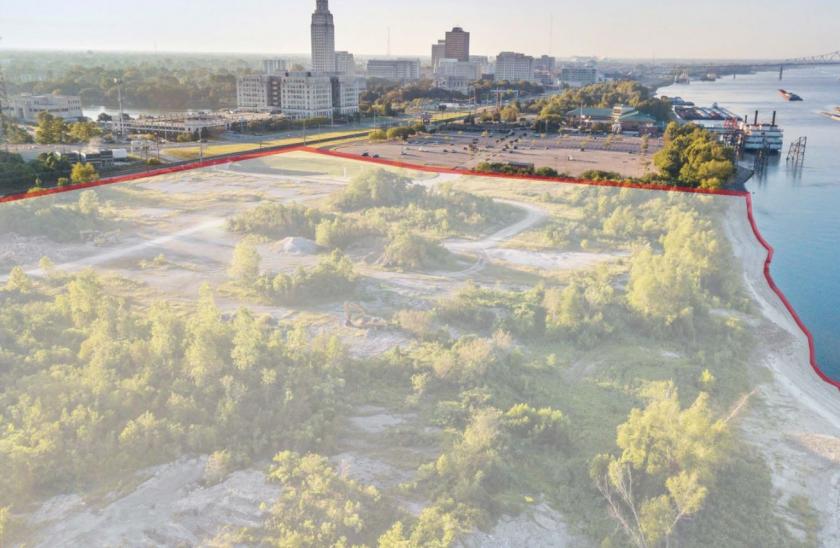
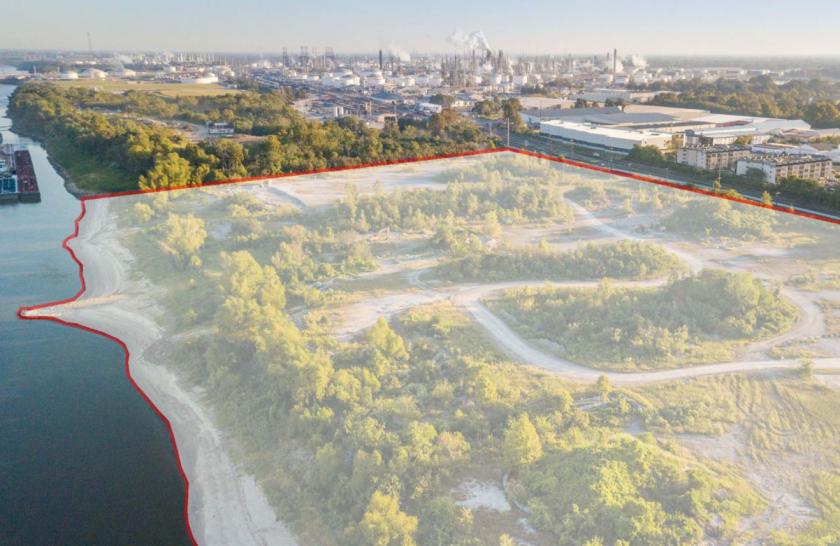
Site Description: +/- 23.523 Acres with 1,846 linear feet of frontage on the Mississippi River. Located in a Qualified Opportunity Zone.Rare opportunity to acquire a large development tract on the Mississippi River. Situated on high ground with no view obstruction from the levee, this incredible property is in the heart of Downtown Baton Rouge, directly across from the State Capitol Building, and immediately adjacent to Hollywood Casino Baton Rouge on the south. The offering is 23.52 acres of land with 1,846 linear feet of frontage on the Mississippi River.The River Park Development concept gained approval for incredible density under an existing Planned Unit Development, centering around a 125,000 square foot Mississippi Riverfront entertainment district with both indoor and outdoor performance venues, a public park and board walk, and including a approximately 500 hotel rooms, 1,100 multi-family units, 400,000 square feet of retail space and up to 600,000 square feet of office space.The phased development plans are incentivized by economic development zone designation, and a TIF, which was was secured in order to levee a 2% tax on anything sold on the property. Corp of Engineers permits had also been secured.Phase I was the construction of a four-lane, interstate grade underpass that allowed unobstructed ingress & egress to the property, as access was previously obstructed by the Canadian National Rail Road. Phase I has been completed.Conceptual Plans & renderings demonstrate the potential of what could be developed on the property in future phases of development and are available upon request.